Data Lineage
Overview
The Lineage Graph is a visual map of dependencies between data products.
It shows:
- Where data originates,
- How data moves between data products
- Which products provide outputs that can be consumed, such as tables, APIs, or other published interfaces.
The lineage graph helps data consumers:
- Understand upstream dependencies that influence a data product.
- Evaluate whether a data product fits their analytical or operational needs.
- Identify downstream consumers to assess the potential impact of changes.
Accessing the Lineage Graph
The Lineage Graph is specific to each data product, showing its inputs and outputs.
You can access it in two ways:
-
From Visual Discovery: hover on a data product node, open the popover, and click on Lineage.
-
From the Data Product Page: open the data product's detail page and navigate to the Lineage tab.
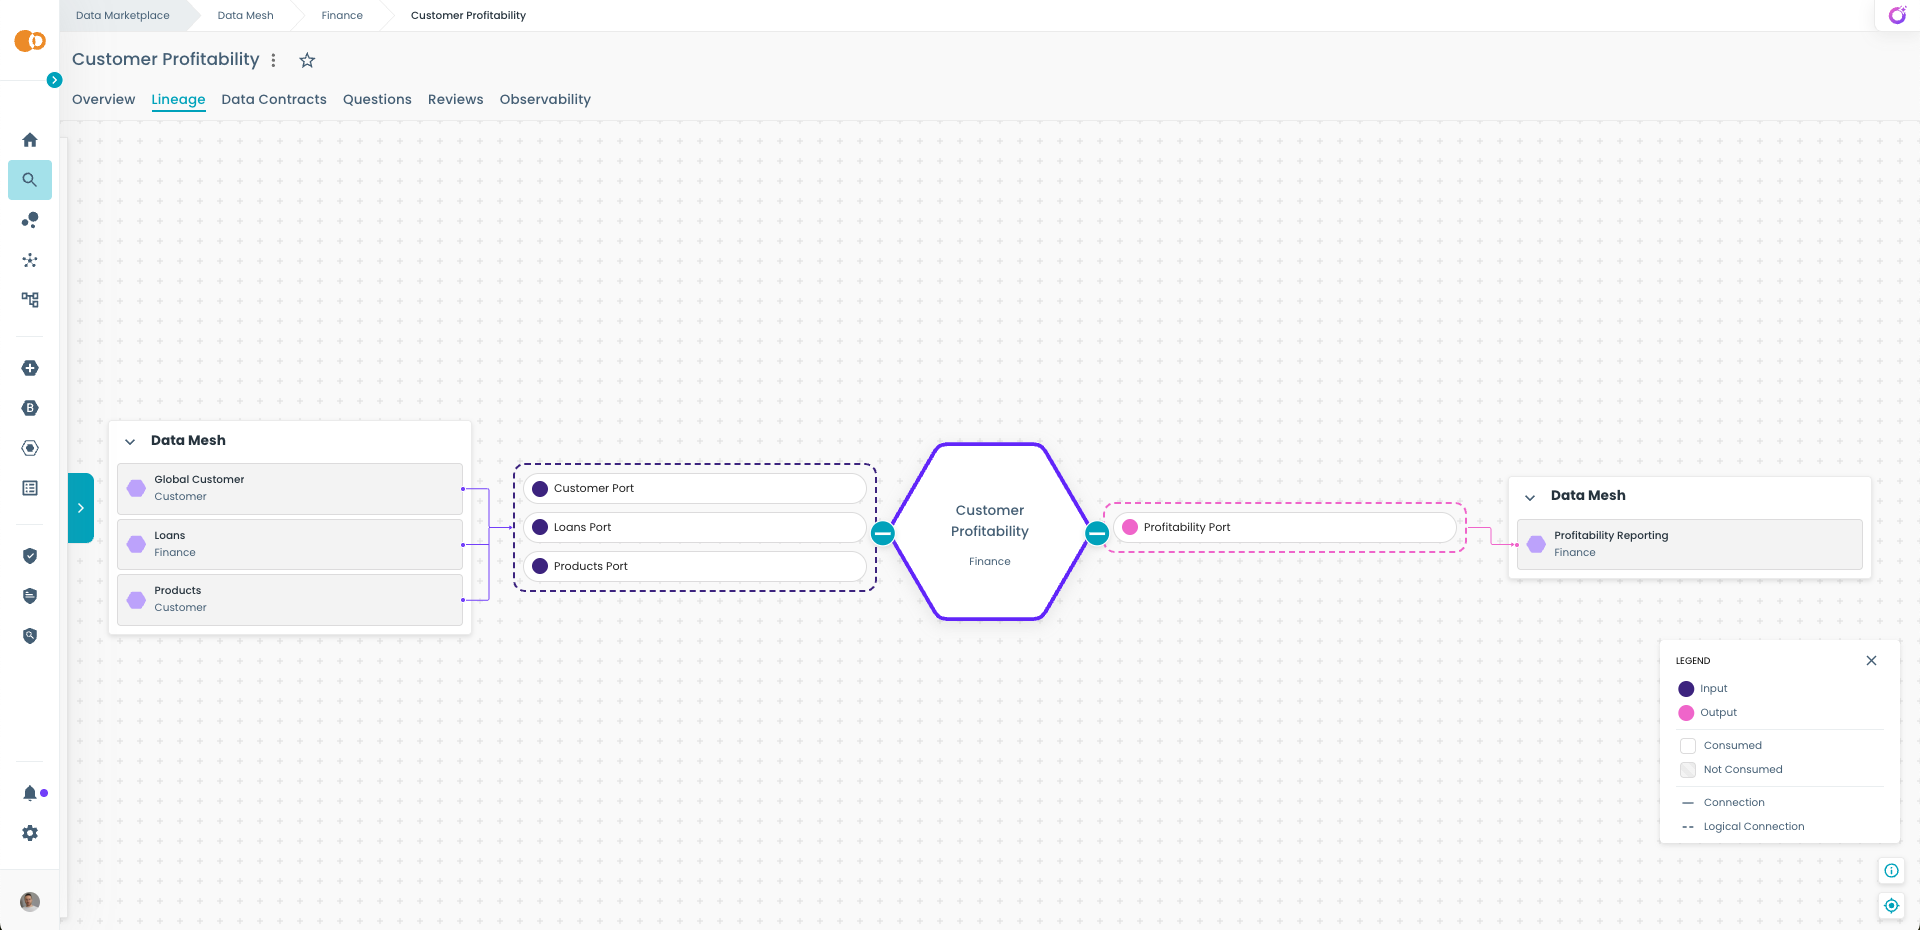
Understanding the Lineage Graph
When you open a Lineage Graph:
- The data product you are exploring is always shown at the center.
- Left side: shows upstream data products that the central product depends on.
- Right side: shows downstream data products that consume its outputs.
Types of Connections
Connections are represented with two distinct visual styles:
Solid Line — Connection
- Represents an active, fully documented relationship with a real, operational data flow.
- The upstream data product actively provides data to the downstream data product.
- A solid line connection always links a consumer data product to a specific consumable interface, such as a published output port.
- All the necessary components and interfaces involved are fully detailed in the lineage graph.
Use solid lines to:
- Identify current, consumable outputs available for immediate use.
- Trace exact paths of data flow with complete documentation.
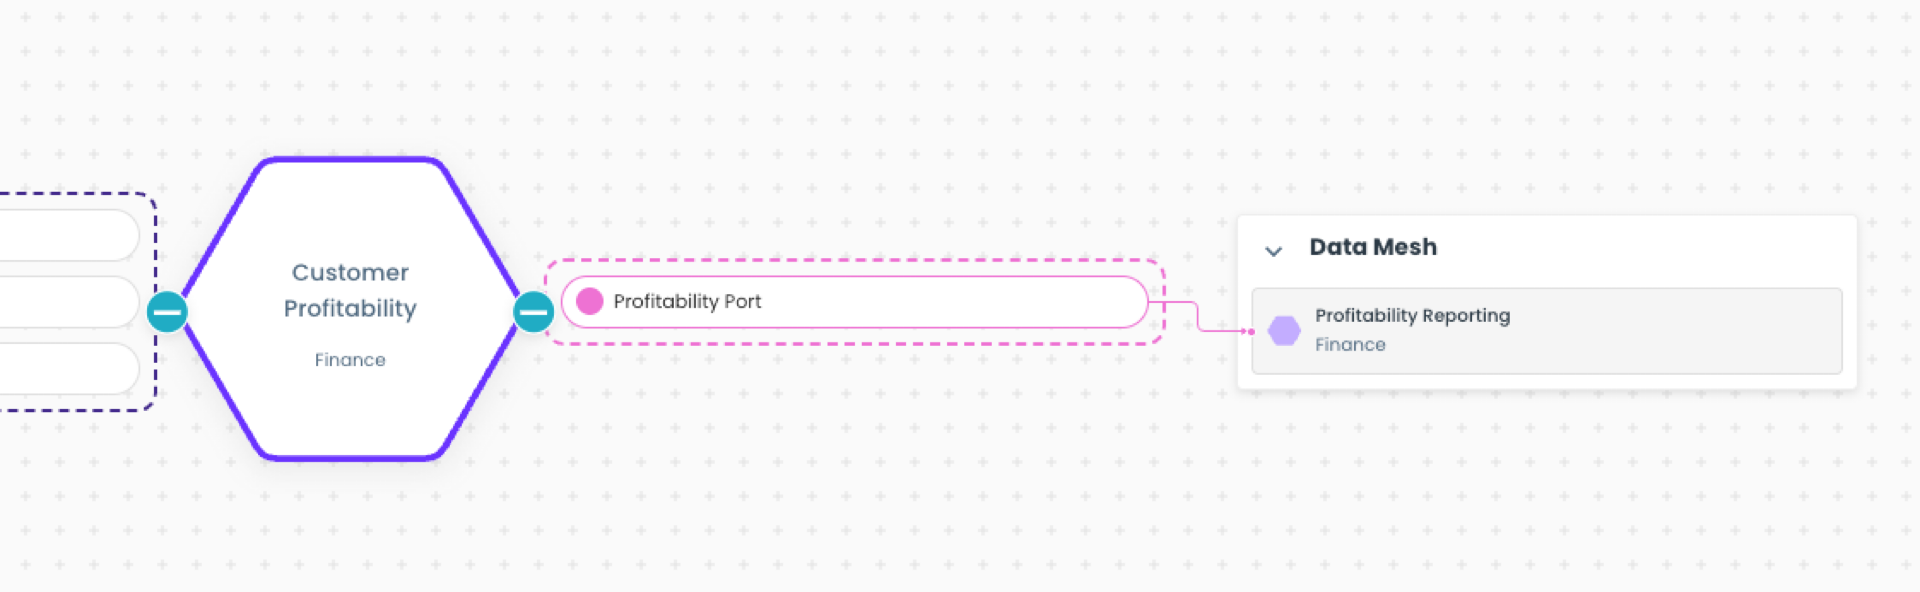
In the example in the above image, the lineage graph describes a solid line connection, representing a fully documented and active data flow between two data products:
- The Customer Profitability data product (center) exposes a specific output, the Profitability Port.
- The Profitability Reporting data product (right) actively consumes this output, establishing a direct, operational dependency.
Because the line is solid, it indicates that:
- This is a real, operational relationship, not just a design-level or conceptual dependency.
- The connection is fully detailed in the Marketplace, linking a consumer data product to a specific consumable interface (the output port).
This makes it clear to both producers and consumers exactly which output is being used and where the data is flowing.
Dashed Line -- Logical Connection
- Represents a planned, conceptual, or partially documented dependency.
- Common scenarios:
- There is no active data flow yet, but the relationship is planned for the future.
- There is an active data flow, but not all elements are documented in the Marketplace: the logical connection acts as a placeholder to indicate the relationship at a higher level.
- A logical connection can also link one data product directly to another or connect a product to a group of outputs, without detailing each specific connection.
Logical connections are useful for:
- Communicating design-level dependencies without requiring full technical detail.
- Documenting known relationships where the exact infrastructure is not yet represented.
- Showing future or high-level integrations while avoiding clutter in the graph.
Example
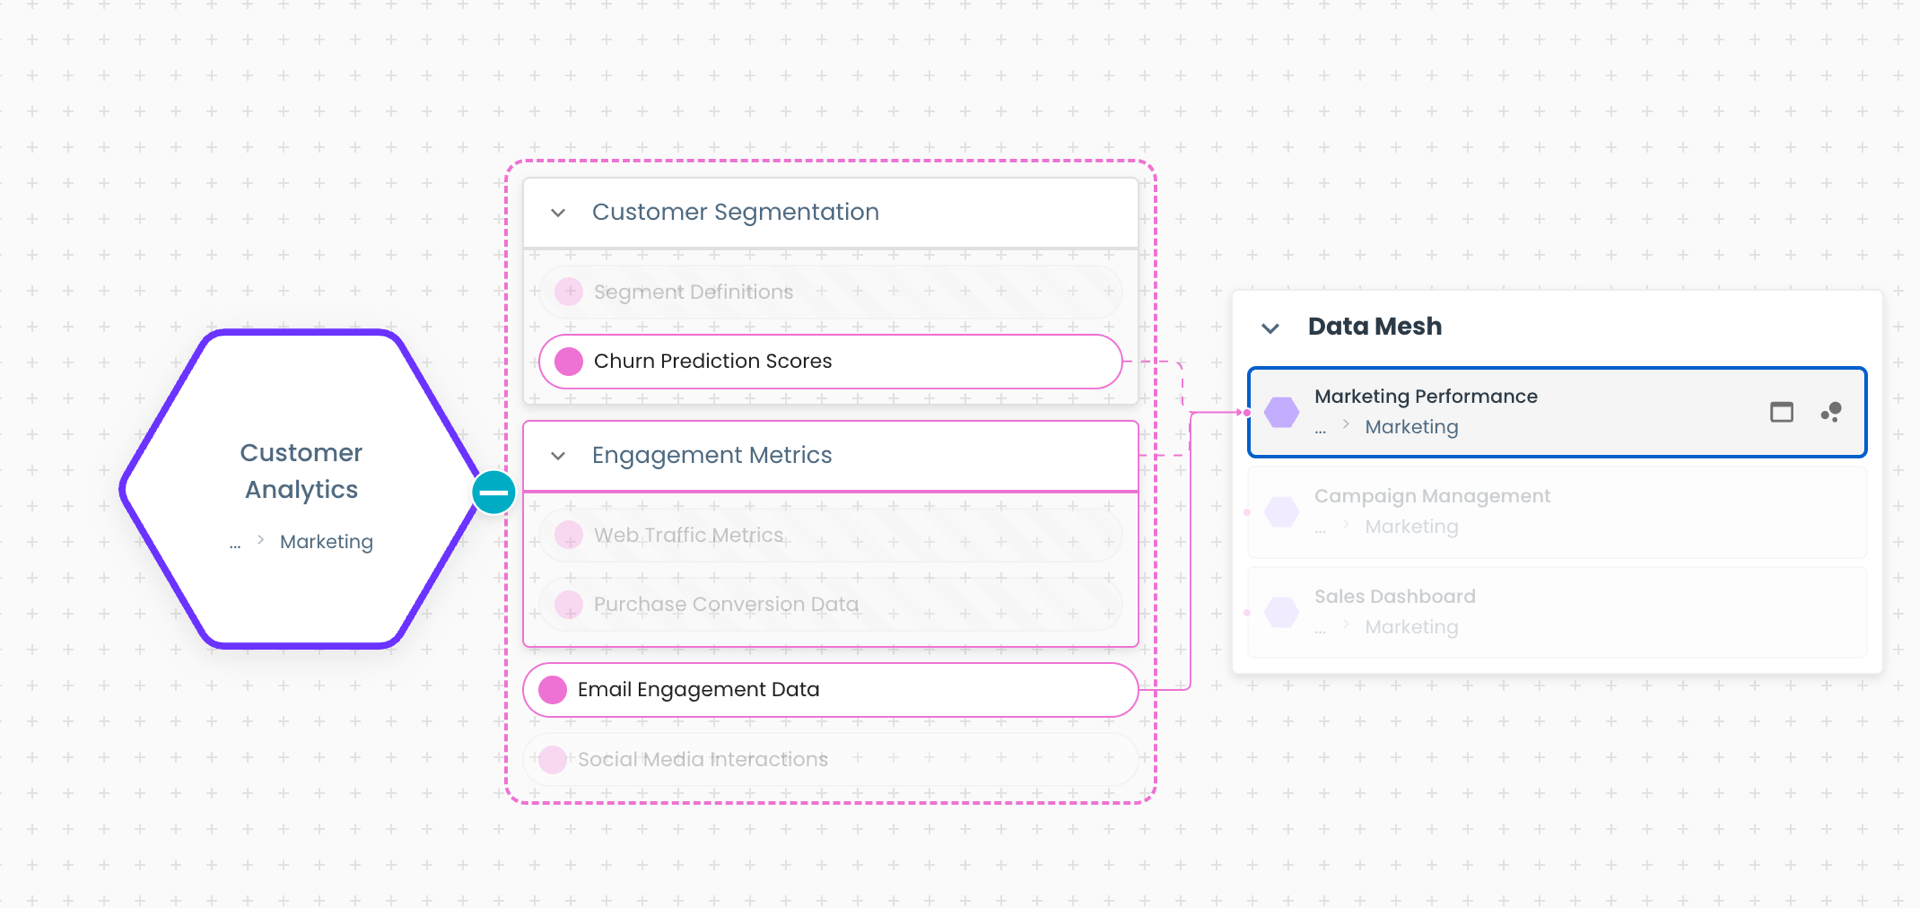
In this example:
- Churn Prediction Scores is a specific consumable output within the Customer Segmentation group.
- The dotted line connecting it to Marketing Performance shows a logical relationship, meaning either:
- The data flow does not exist yet and is planned, or
- The flow exists, but the full technical details are not documented.
- The dotted line connecting it to Marketing Performance shows a logical relationship, meaning either:
- Engagement Metrics contains two consumable outputs:
- Web Traffic Metrics
- Purchase Conversion Data
- The dotted line to the entire group indicates that Marketing Performance relies on one or both of these outputs, but the connection is kept at the group level to avoid clutter or because the exact details are not available.
- Email Engagement Data, however, has a solid line, representing a fully documented, active dependency, where Marketing Performance directly consumes this specific output.
If you are a data producer, learn how to define these kinds of connections.
Navigating the Lineage
You can explore the lineage graph interactively by shifting focus to any upstream or downstream data product.
- Click on the focus icon on a data product in the graph to place it at the center of the view.
- This allows you to follow data flows step-by-step, moving upstream or downstream to better understand dependencies and impacts.
- From any node, you can also open the detail page of a data product or one of its output ports to view its metadata, documentation, and other details.
This makes it easy to navigate complex relationships, trace dependencies in depth, and drill down into specific products or outputs directly from the graph.