Getting started
Let's take a look at how you can start your journey by creating a Data Product in Witboost.
Prerequisites
As this is only an introductory overview, you do not need to take any action during this walkthrough. But in general, to start using the platform, you should already:
- Be able to log in to Witboost through your credentials or authentication provider
- Have configured Git credentials in your settings OR a global access token has been configured for all Witboost users
- Have at least one Domain defined in the platform
Creating your first Data Product
To create a Data Product, we start with the Builder module
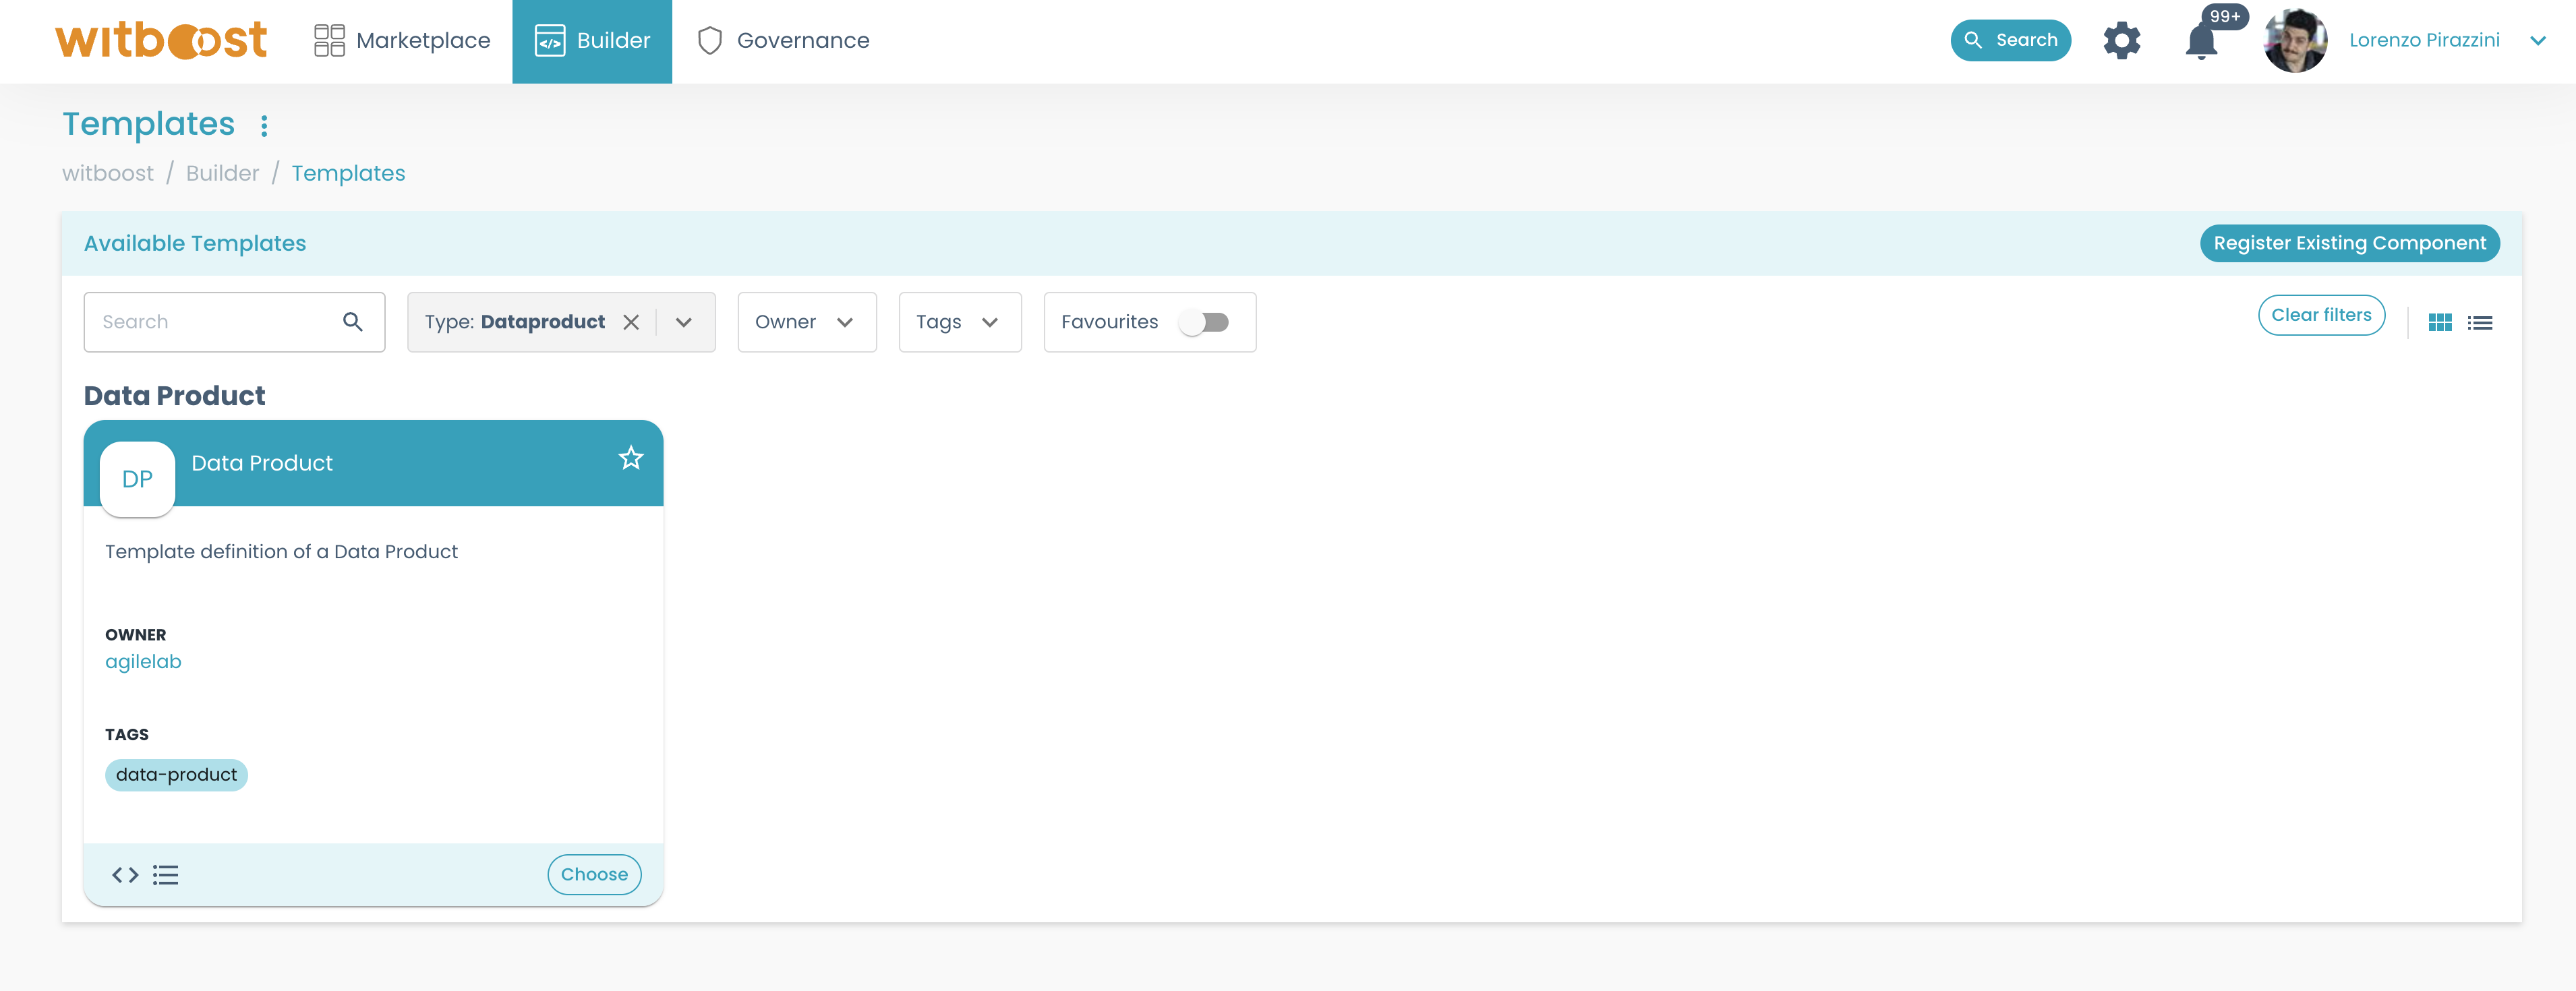
- Go to
Builder>Templatesto get the list of available Builder templates.

- Choose the
Data Producttemplate. this is the most important template in Witboost, and you will always find it in the list.
- Fill the form with the information required, by following the wizard. If you have doubts about how to
fill
Choose a locationsection, you can take a look here
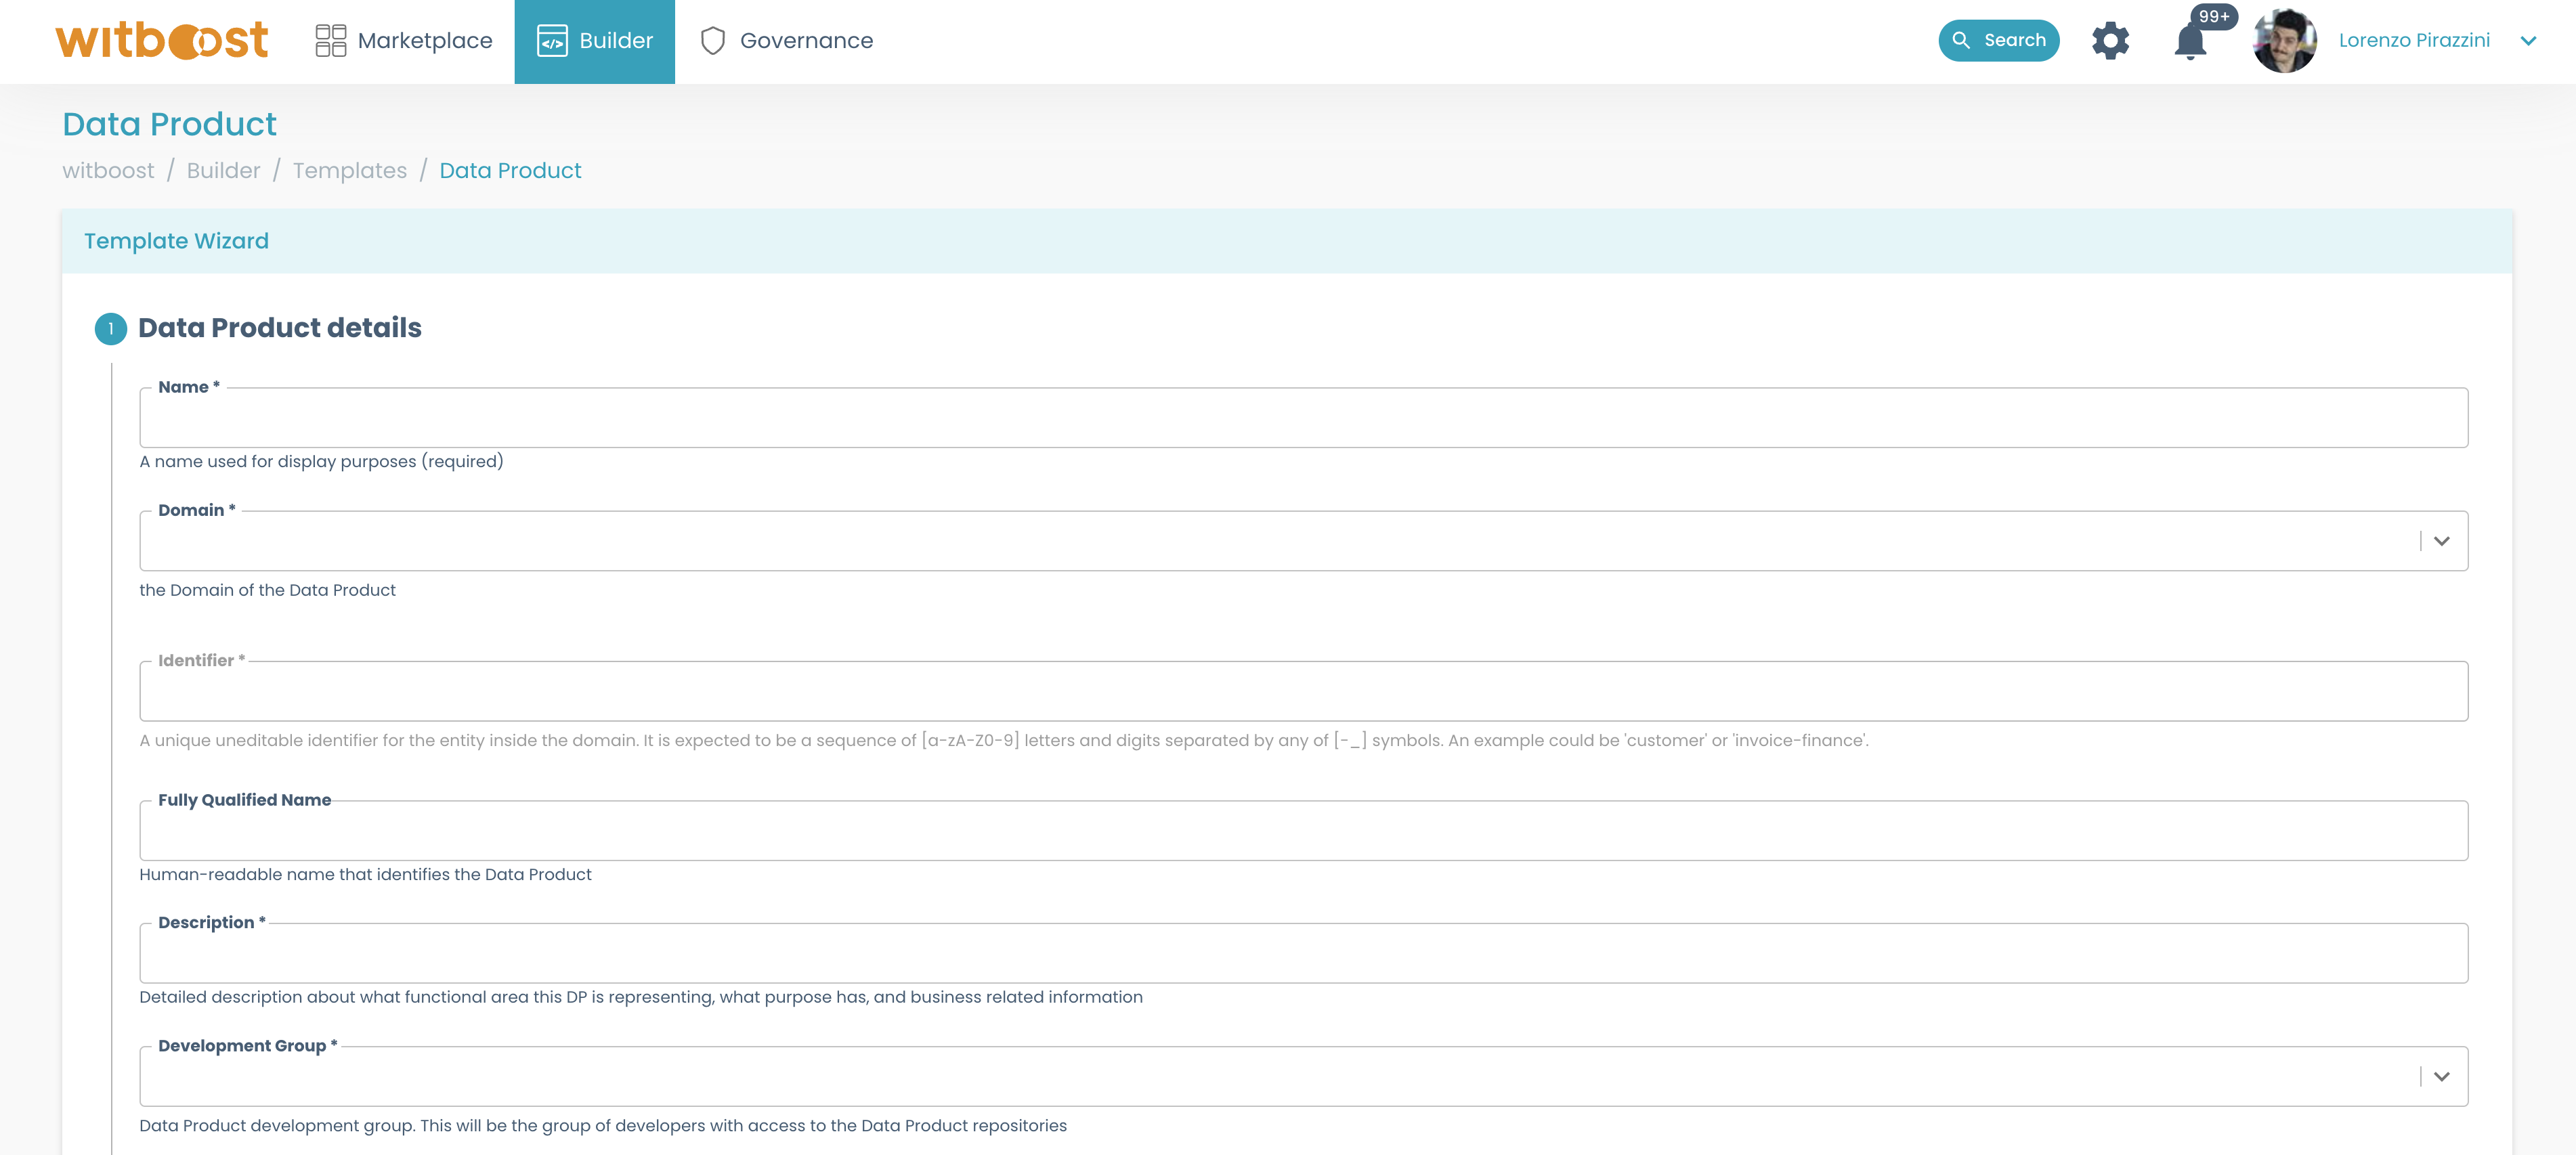
- At the end of the wizard, you can review some of the information filled in the fields. Let's click on
Create. This will start the scaffolding process that will create a new repository will all needed files.
Detailed information about each field can be found on the Data Product Specification page
You are not required to fill in all the metadata immediately, as you can always update it later, either:
- through a visual edit wizard, if enabled by your Platform Team
- or, by directly accessing the data product's Git repository and making changes
Details can be found on Update Data Product Metadata page
The data product is now listed on the My Data Products page. When opening its details page, you should be able to see its
generic information, and the dependencies between that entity and the other ones (e.g. domain, user, etc).
Creating Output Ports for the Data Product
Let's make the Data Product consumable by other domains and users. We will do so by creating an output port.
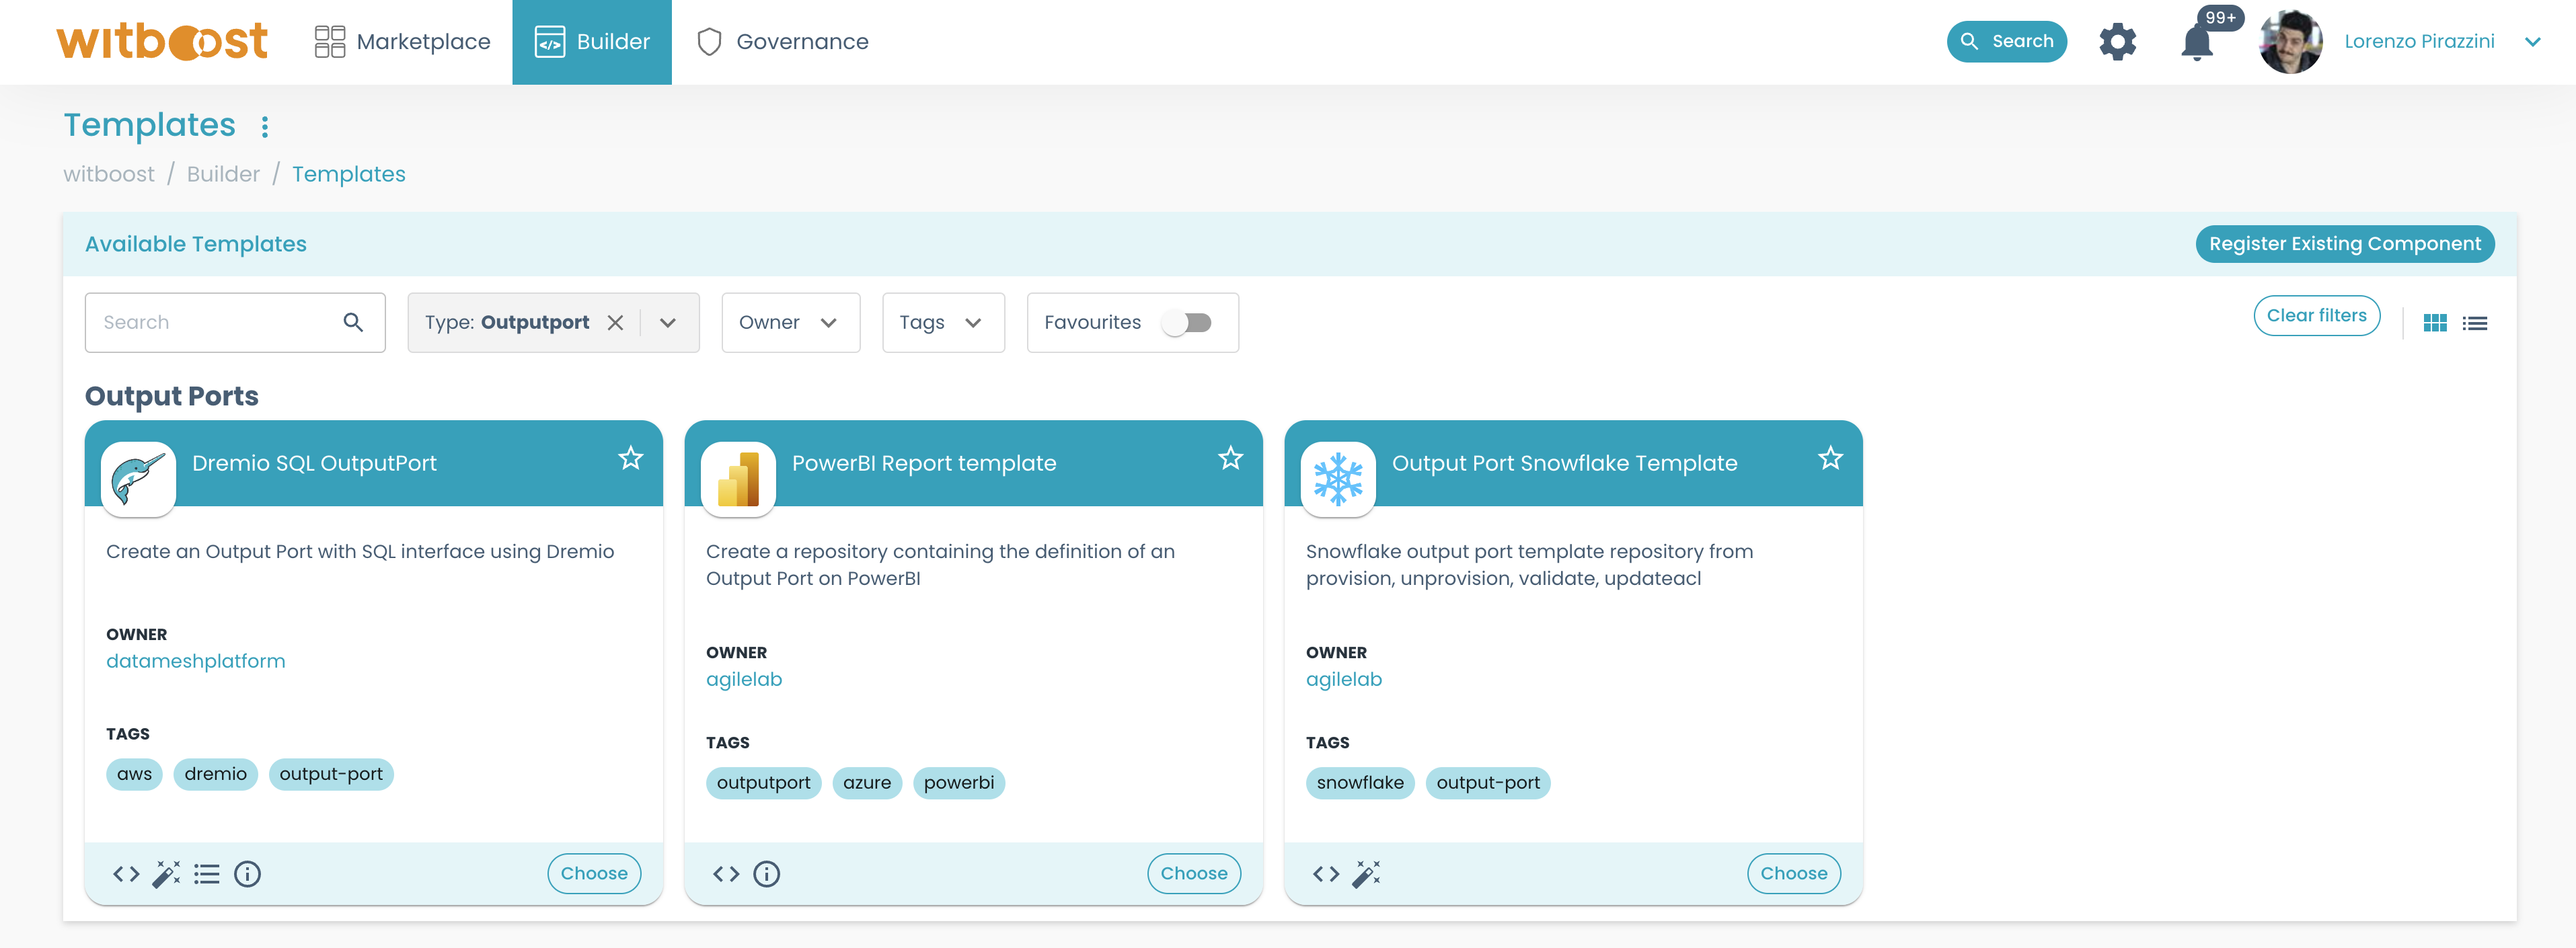
- Get back to the list of templates by clicking on
Builder>Templates. From there, select any of the listed templates. For the sake of the example, we will selectDremio SQL Output Port.
- Again, let's fill in all the needed information, as we did before. This time, make sure to link the Output Port to the right Data Product:
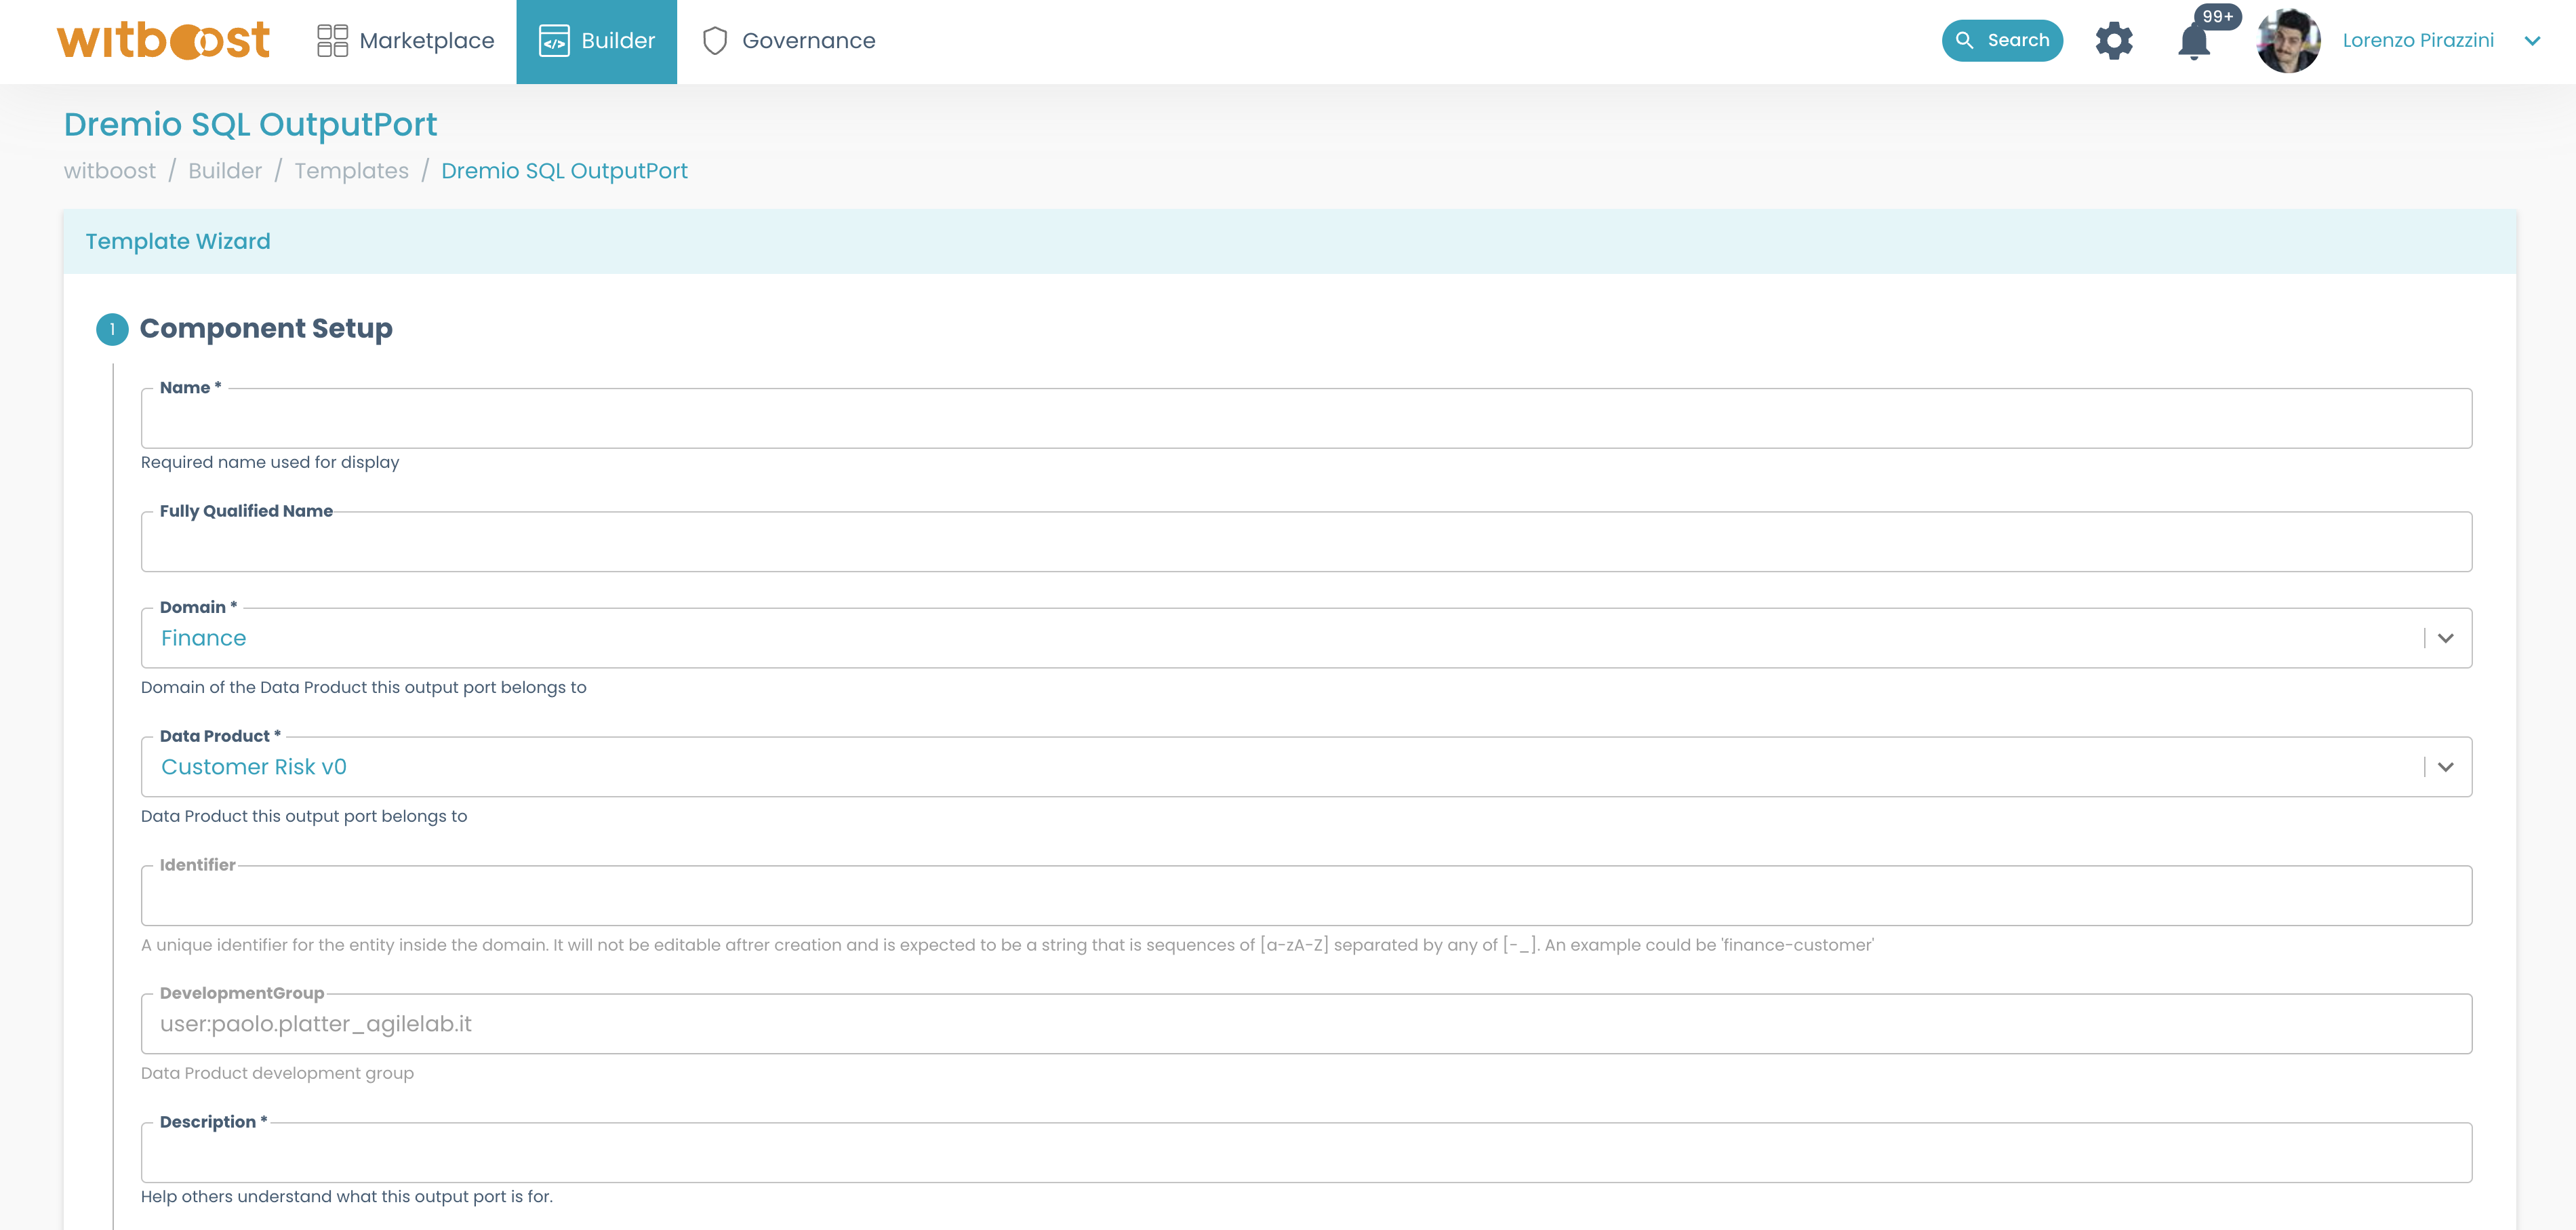
- After following all the steps in the wizard, click on
Create
If you now go back to your Data Product (Builder > My Data Products > <Your Data Product>), you will see in
the Components panel that there will be an Output Port attached to it. In our case, this Output Port will be a Dremio SQL Output Port:
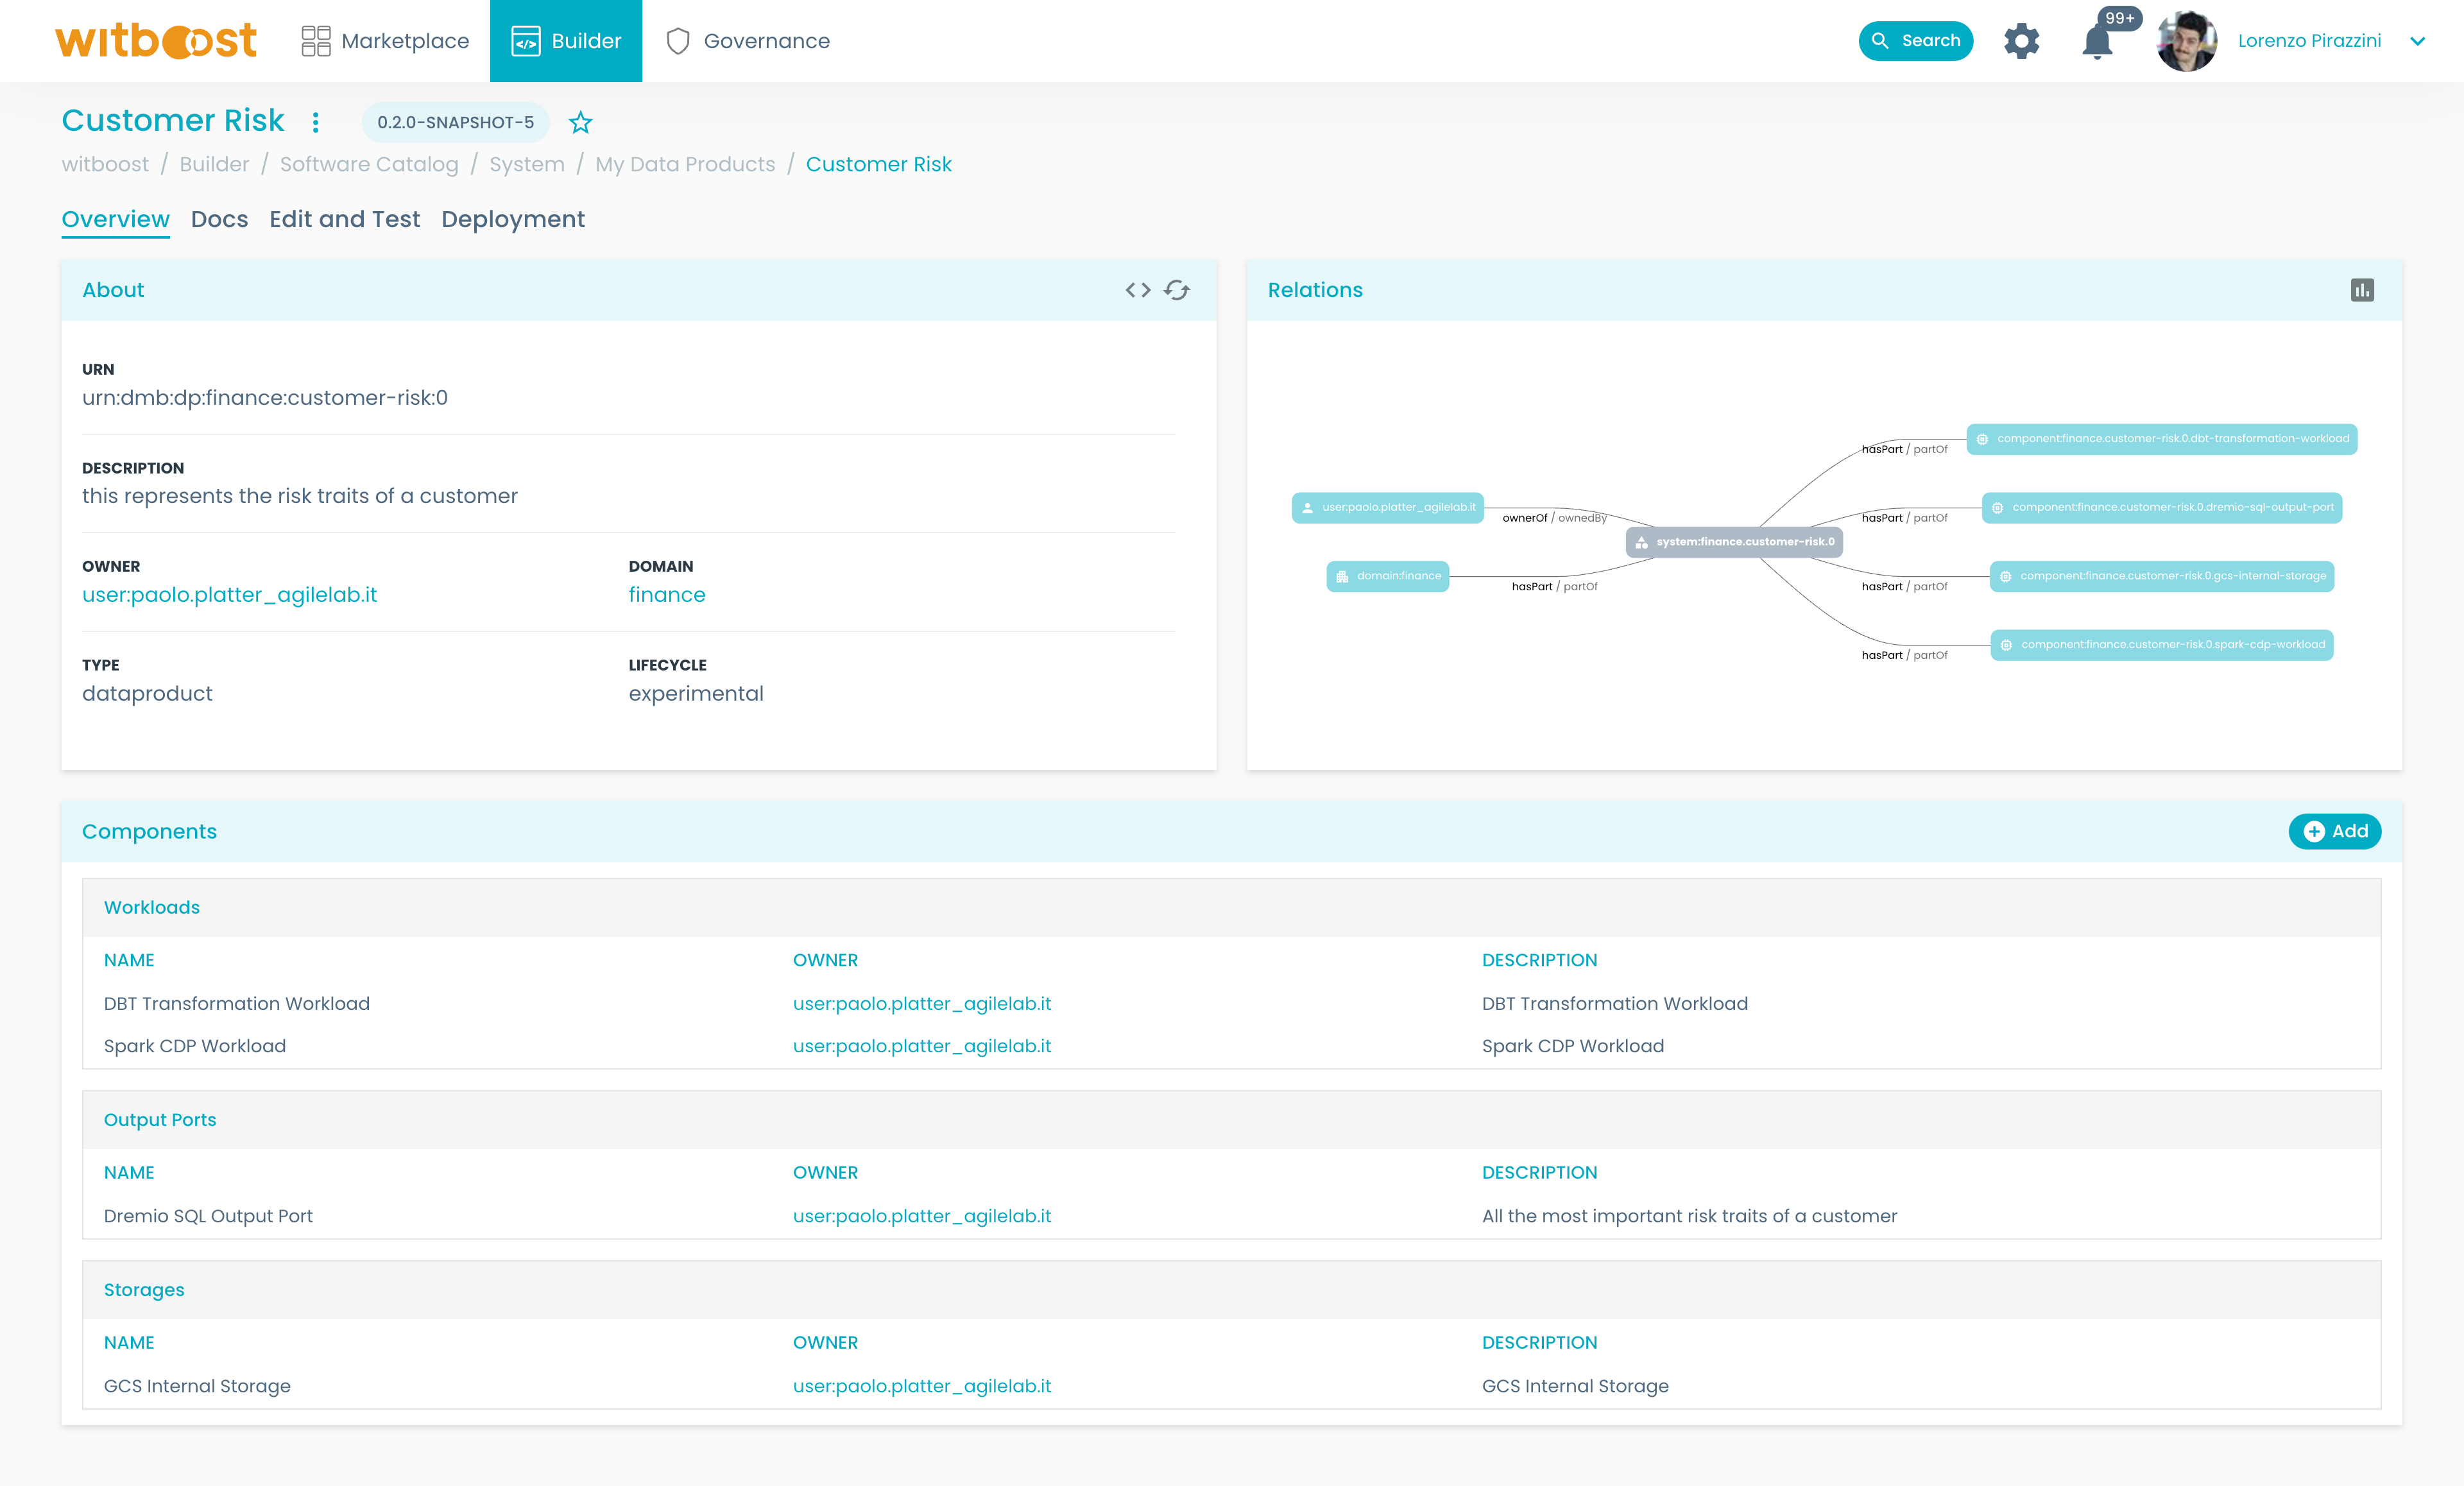
In the example shown in the picture, there were already other components attached to the data product.
If you need to import metadata from an infrastructure service like AWS into your output port, the Reverse Provisioning feature provides a convenient solution. It enables you to effortlessly integrate the desired metadata, potentially saving you a significant amount of time. You can find more information about it in the Reverse Provisioning documentation.
Test the Data Product
After implementing all necessary logic, configurations, and documentation, it's now time to set up our first Data Product for deployment.
We may also want to get a full descriptor preview and eventually check if the Data Product is compliant with all the governance policies defined in the platform.
Let's start by taking a look at a full preview descriptor, to do so:
- Go to
Builder>My Data Products><Your data product>>Edit and Testtab - Select a target environment, for this example, we want to deploy our Data Product in our development environment
- After selecting an environment you will see the full preview descriptor in the
Editorpanel:
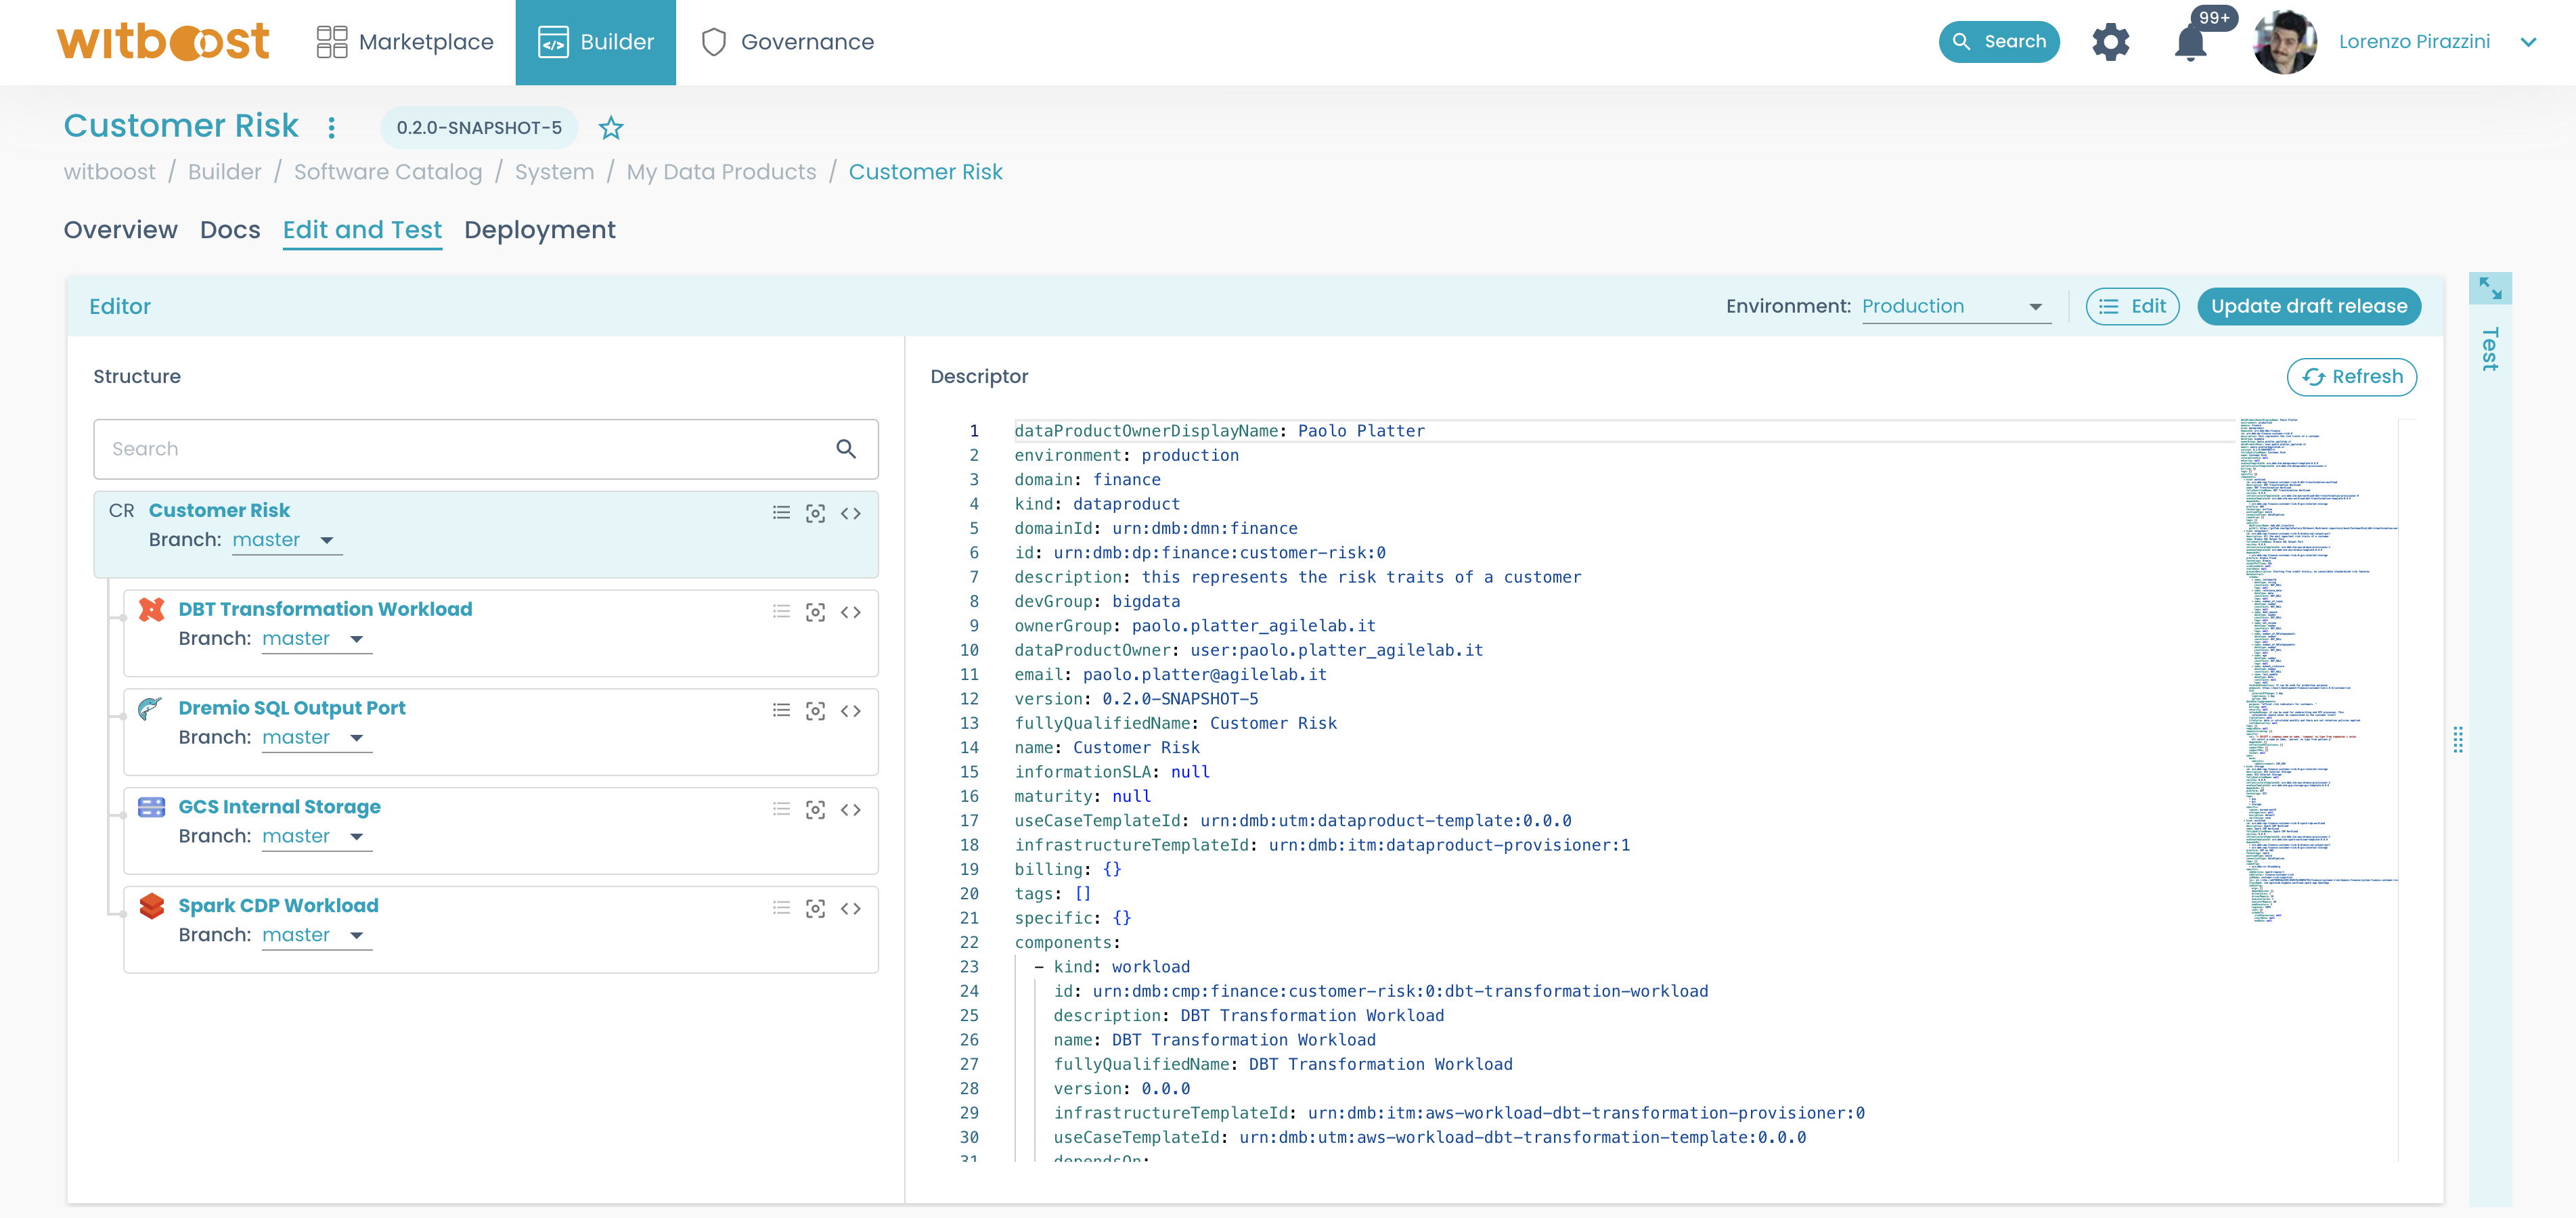
On the left, you can see the structure of the Data Product, with all its components.
If you didn't notice any typos or errors in the descriptor, it's time to test it against governance policies!
To do so, open the Test panel on the right:
- Click on the
Testbutton and let's see the results:
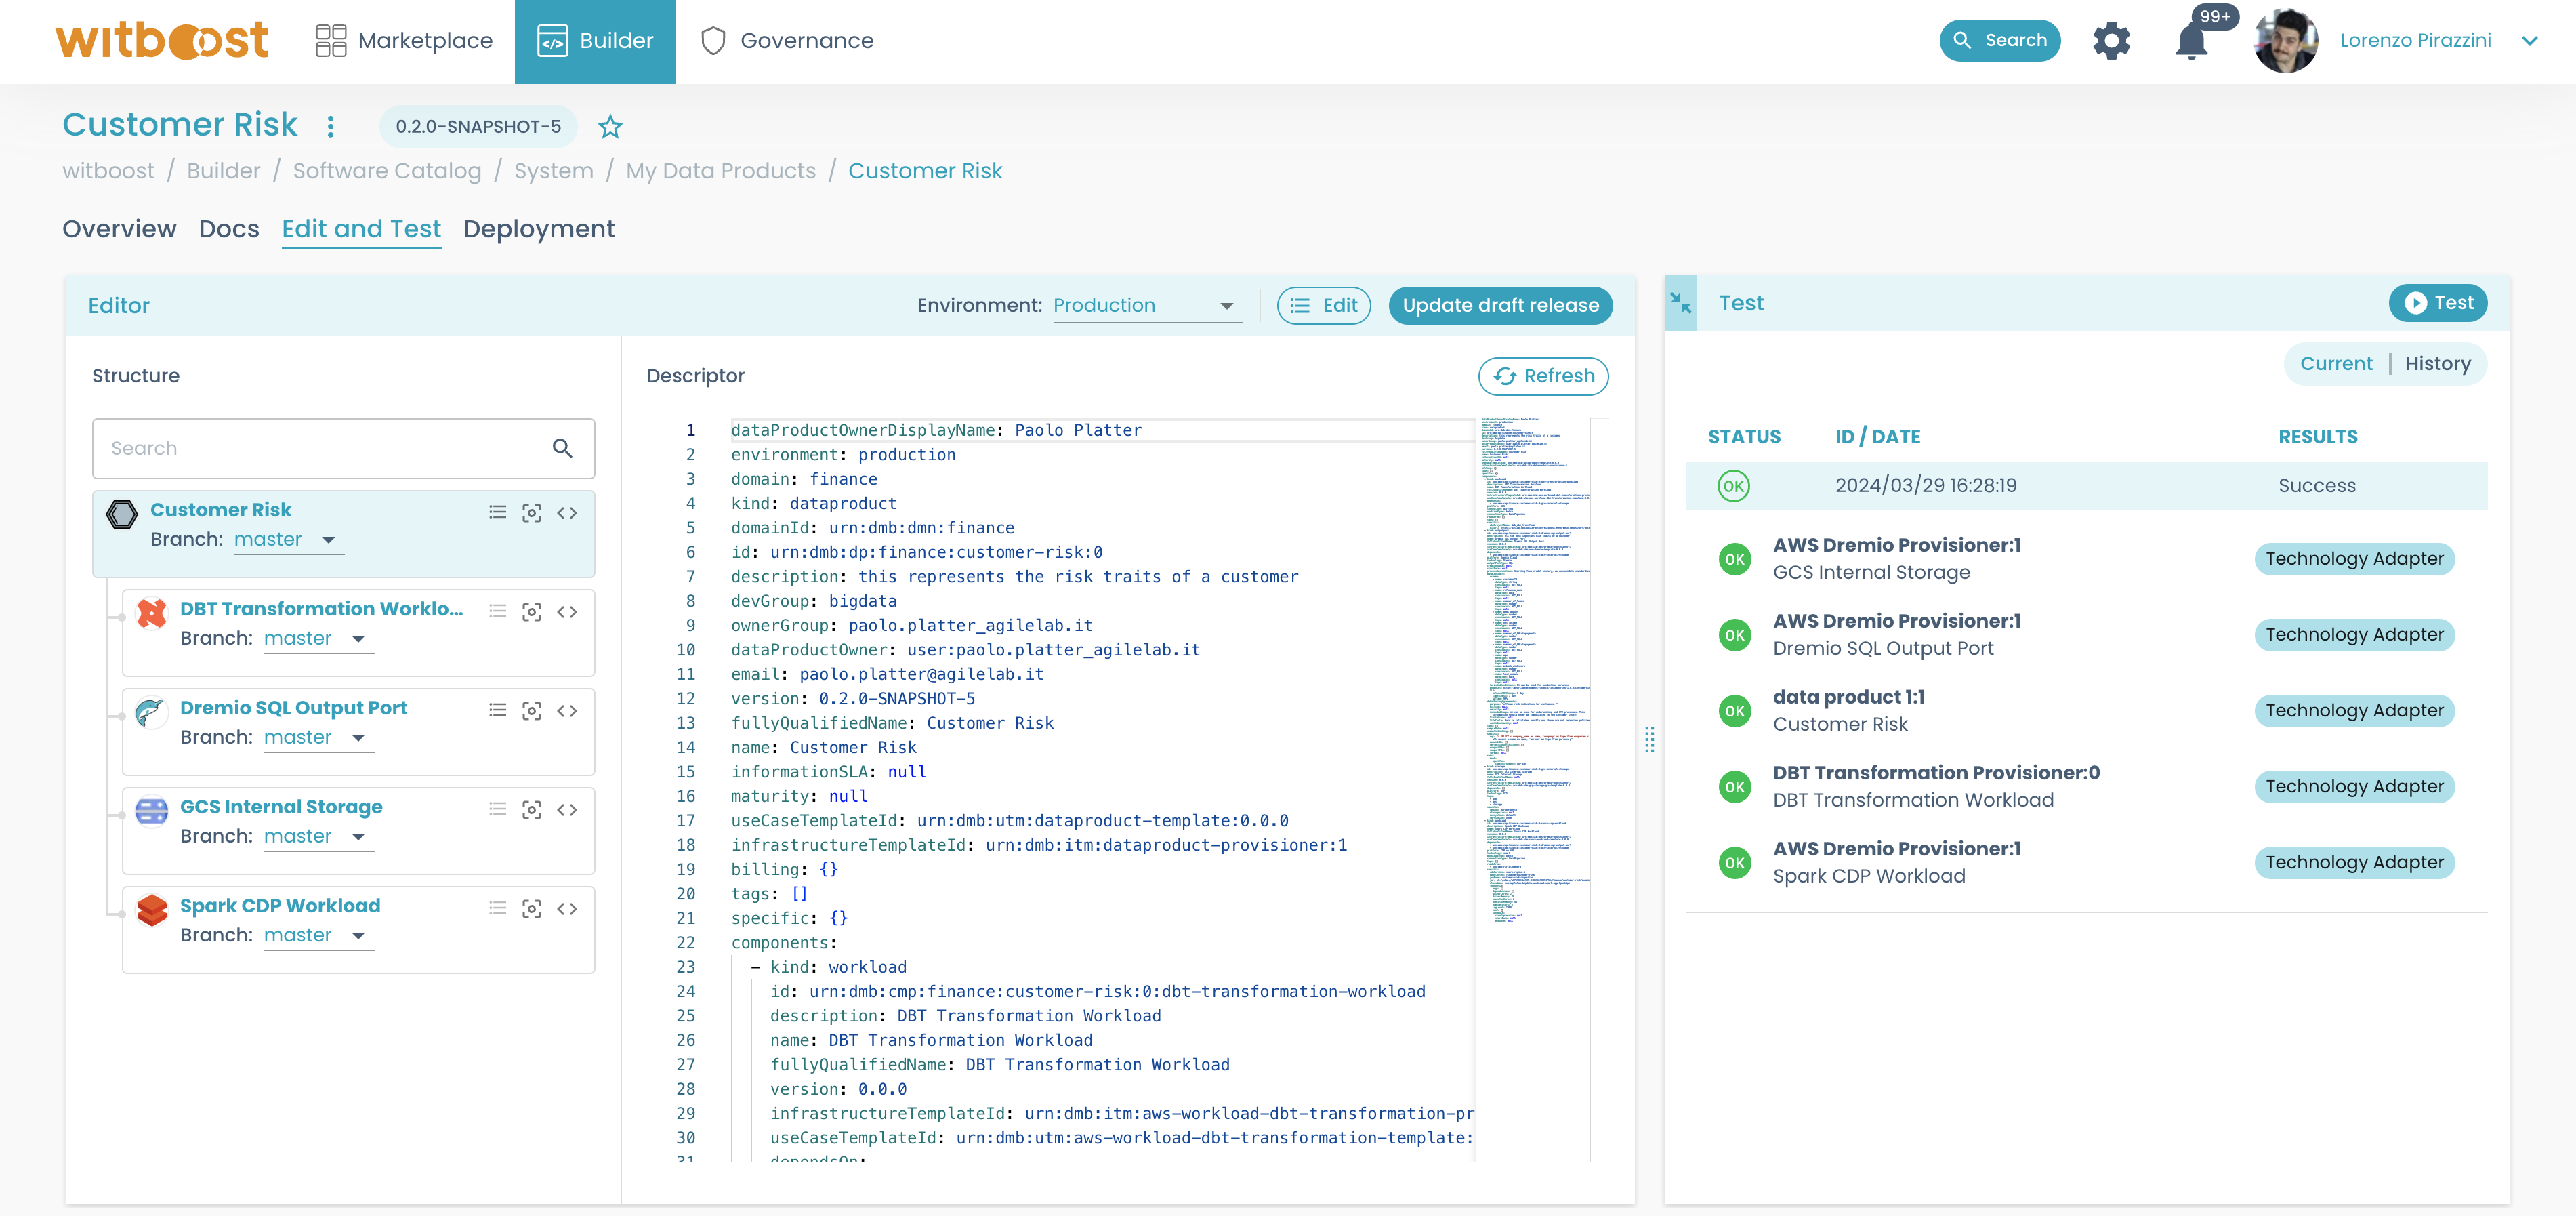
In our case, all the tests performed are OK! Great.
This means our Data Product is compliant with our organization's Governance Policies and we can proceed to the Deploy step.
If instead there is any failing check, you will notice a red mark describing the status of the test.
To inspect the error, click on the test and you will get a list of policy checks performed. The policy checks marked in red as KO means they failed.
For each one, click on the failing check to get the details of the error, then fix it.
Deploying the Data Product
To deploy a Data Product, you will first need a deployment unit: a Release.
Let's see how we can do so and finally deploy our Data Product:
-
Still from the
Edit and Testtab (Builder>My Data Products><Your data product>>Edit and Test) -
Check if the Data Product is ok (by looking at the descriptor and by testing it)
-
In the
Deploymentpanel, click onNew Draft Release. This will create a new draft release right away:
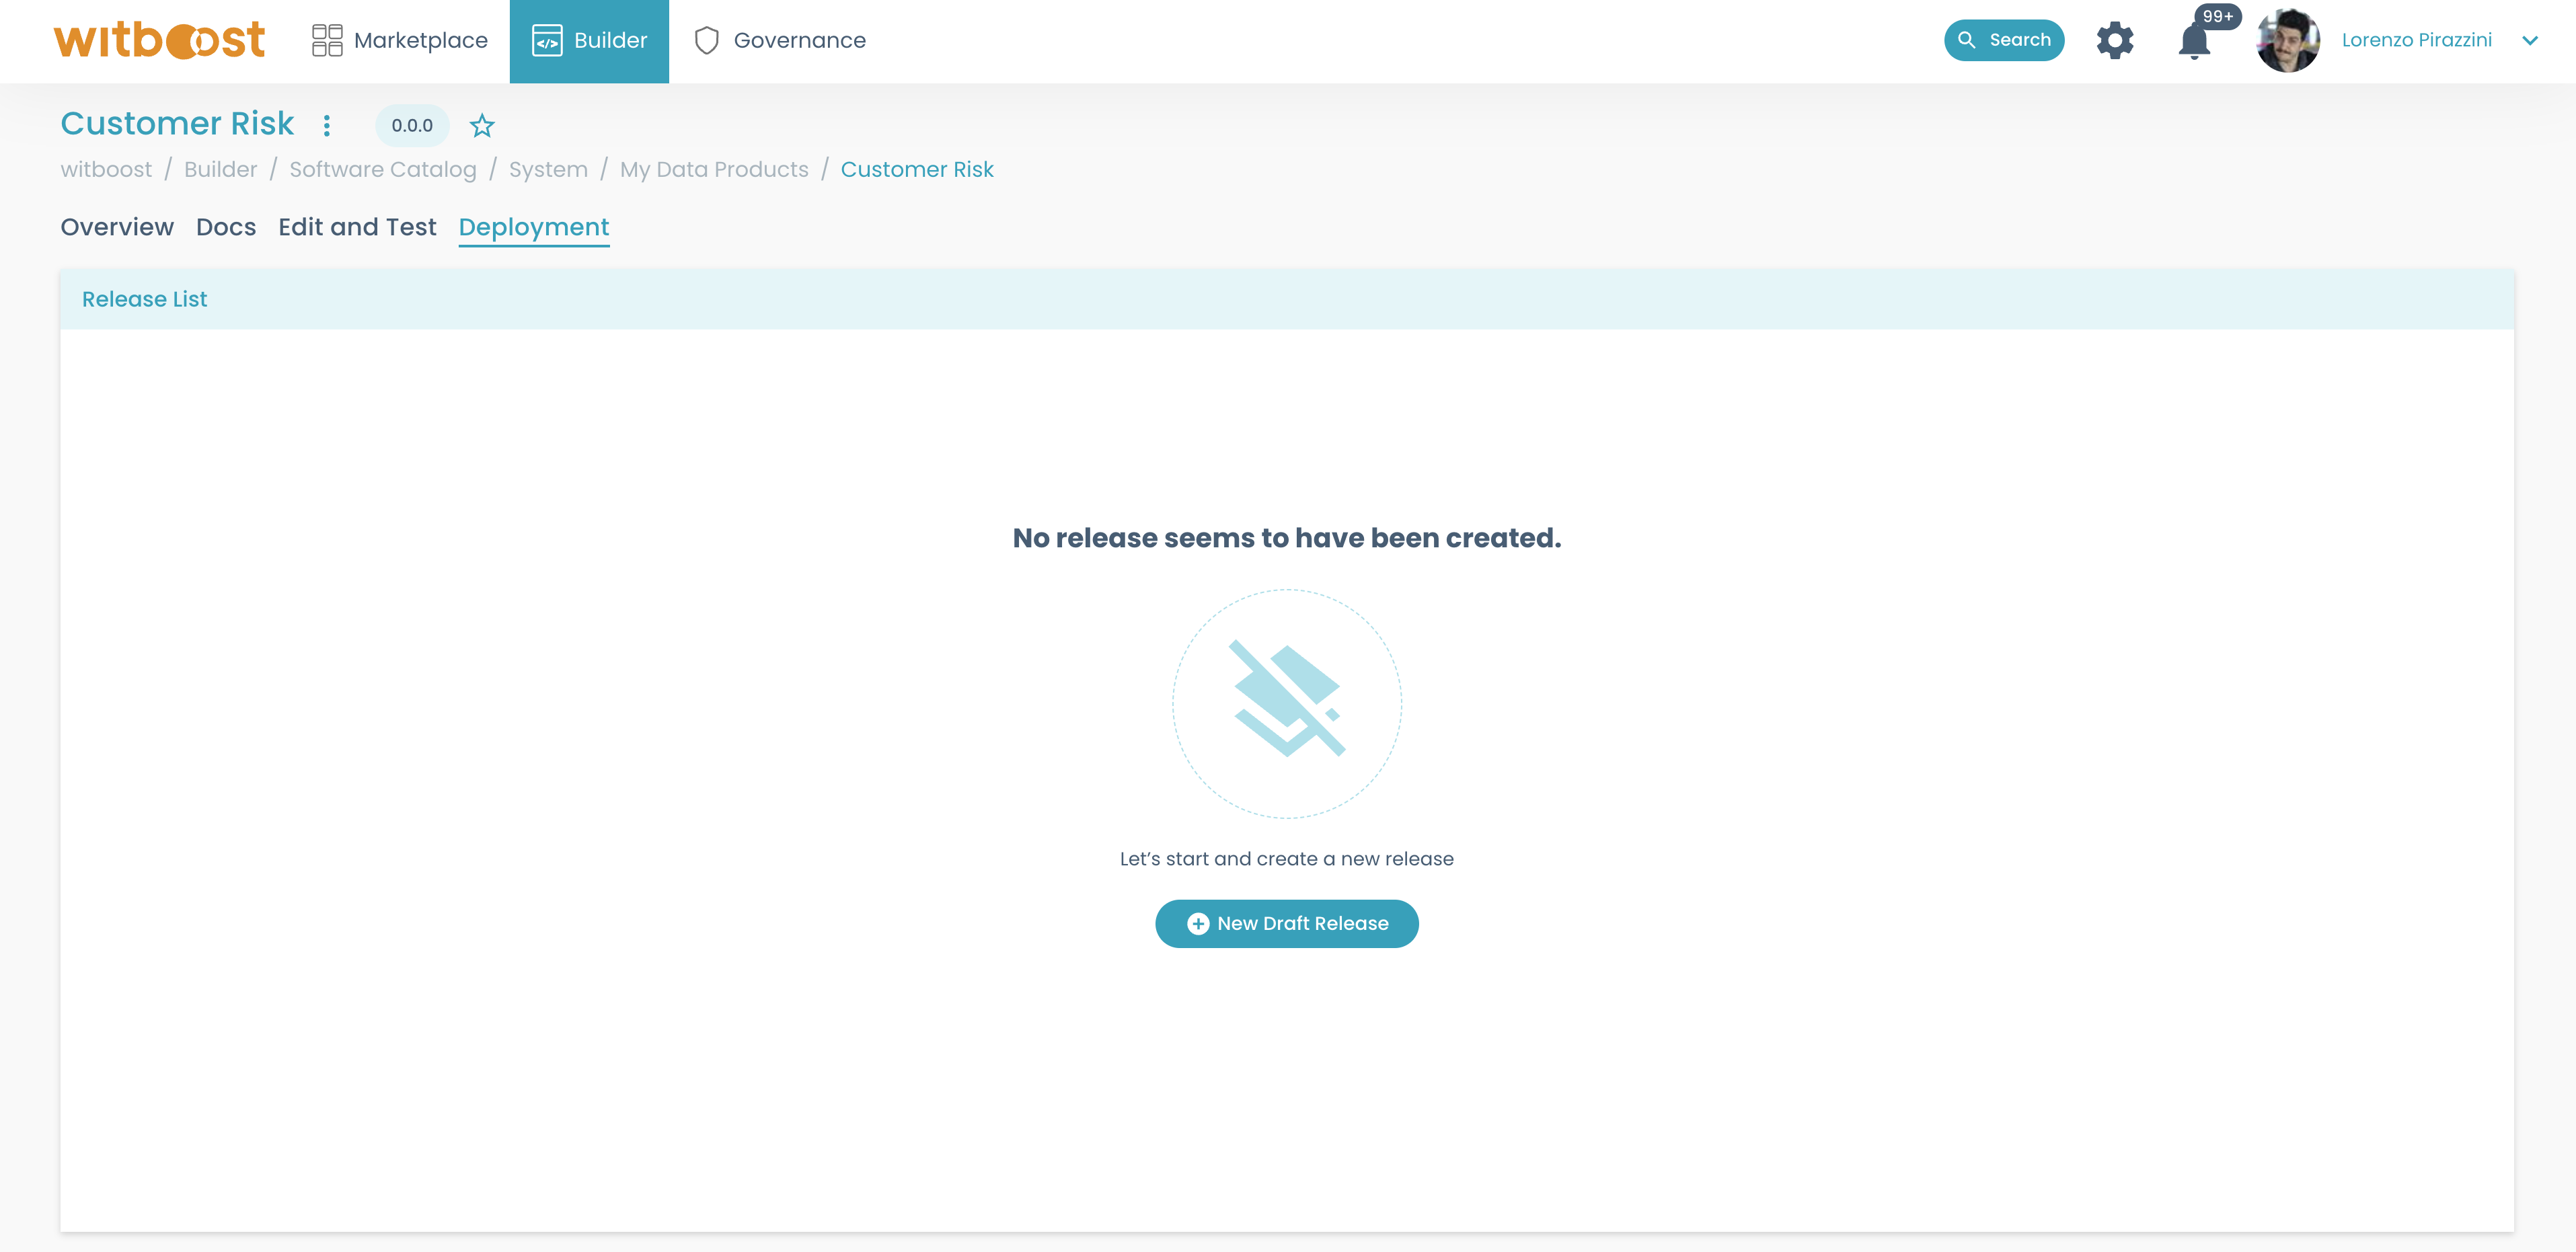
-
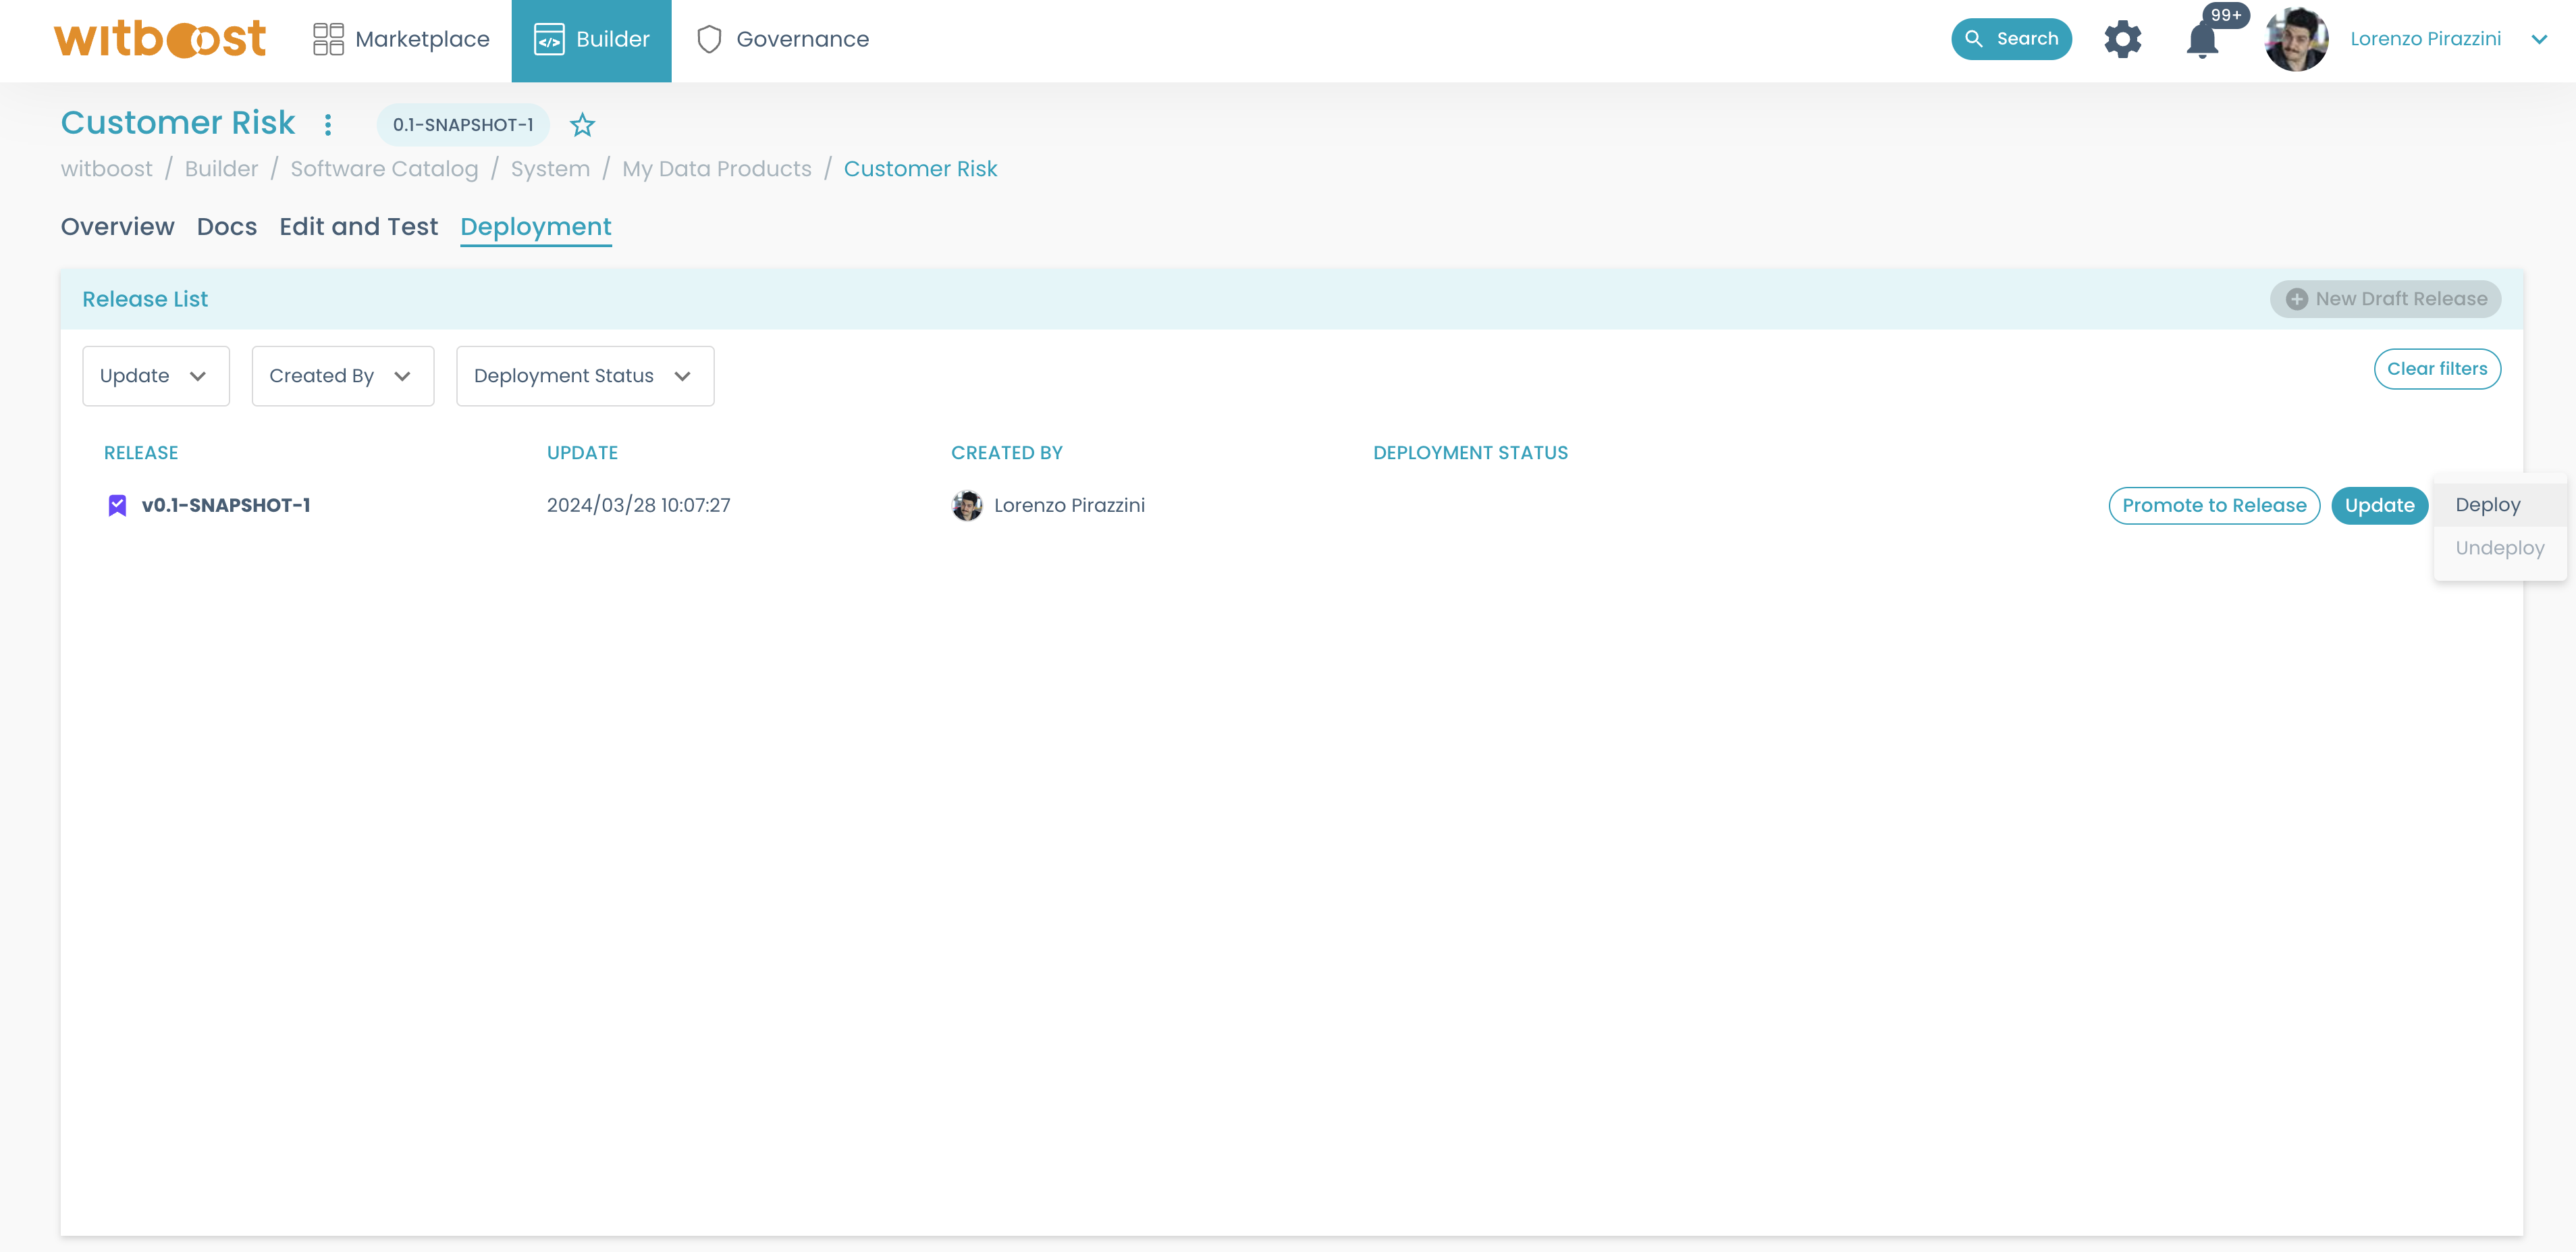
Now you can see the newly created release in the same tab
-
Now you can try to deploy it and see if everything works: click on the menu of the release and select
Deploy. Then choose the desired environment for the deployment: this will start the deployment operation, and redirects you to the release detail page
In the deployment section, some circles will appear: each circle represents the deployment status of a step (initialization, finalization, provisioning for each component, including the data product itself, etc)
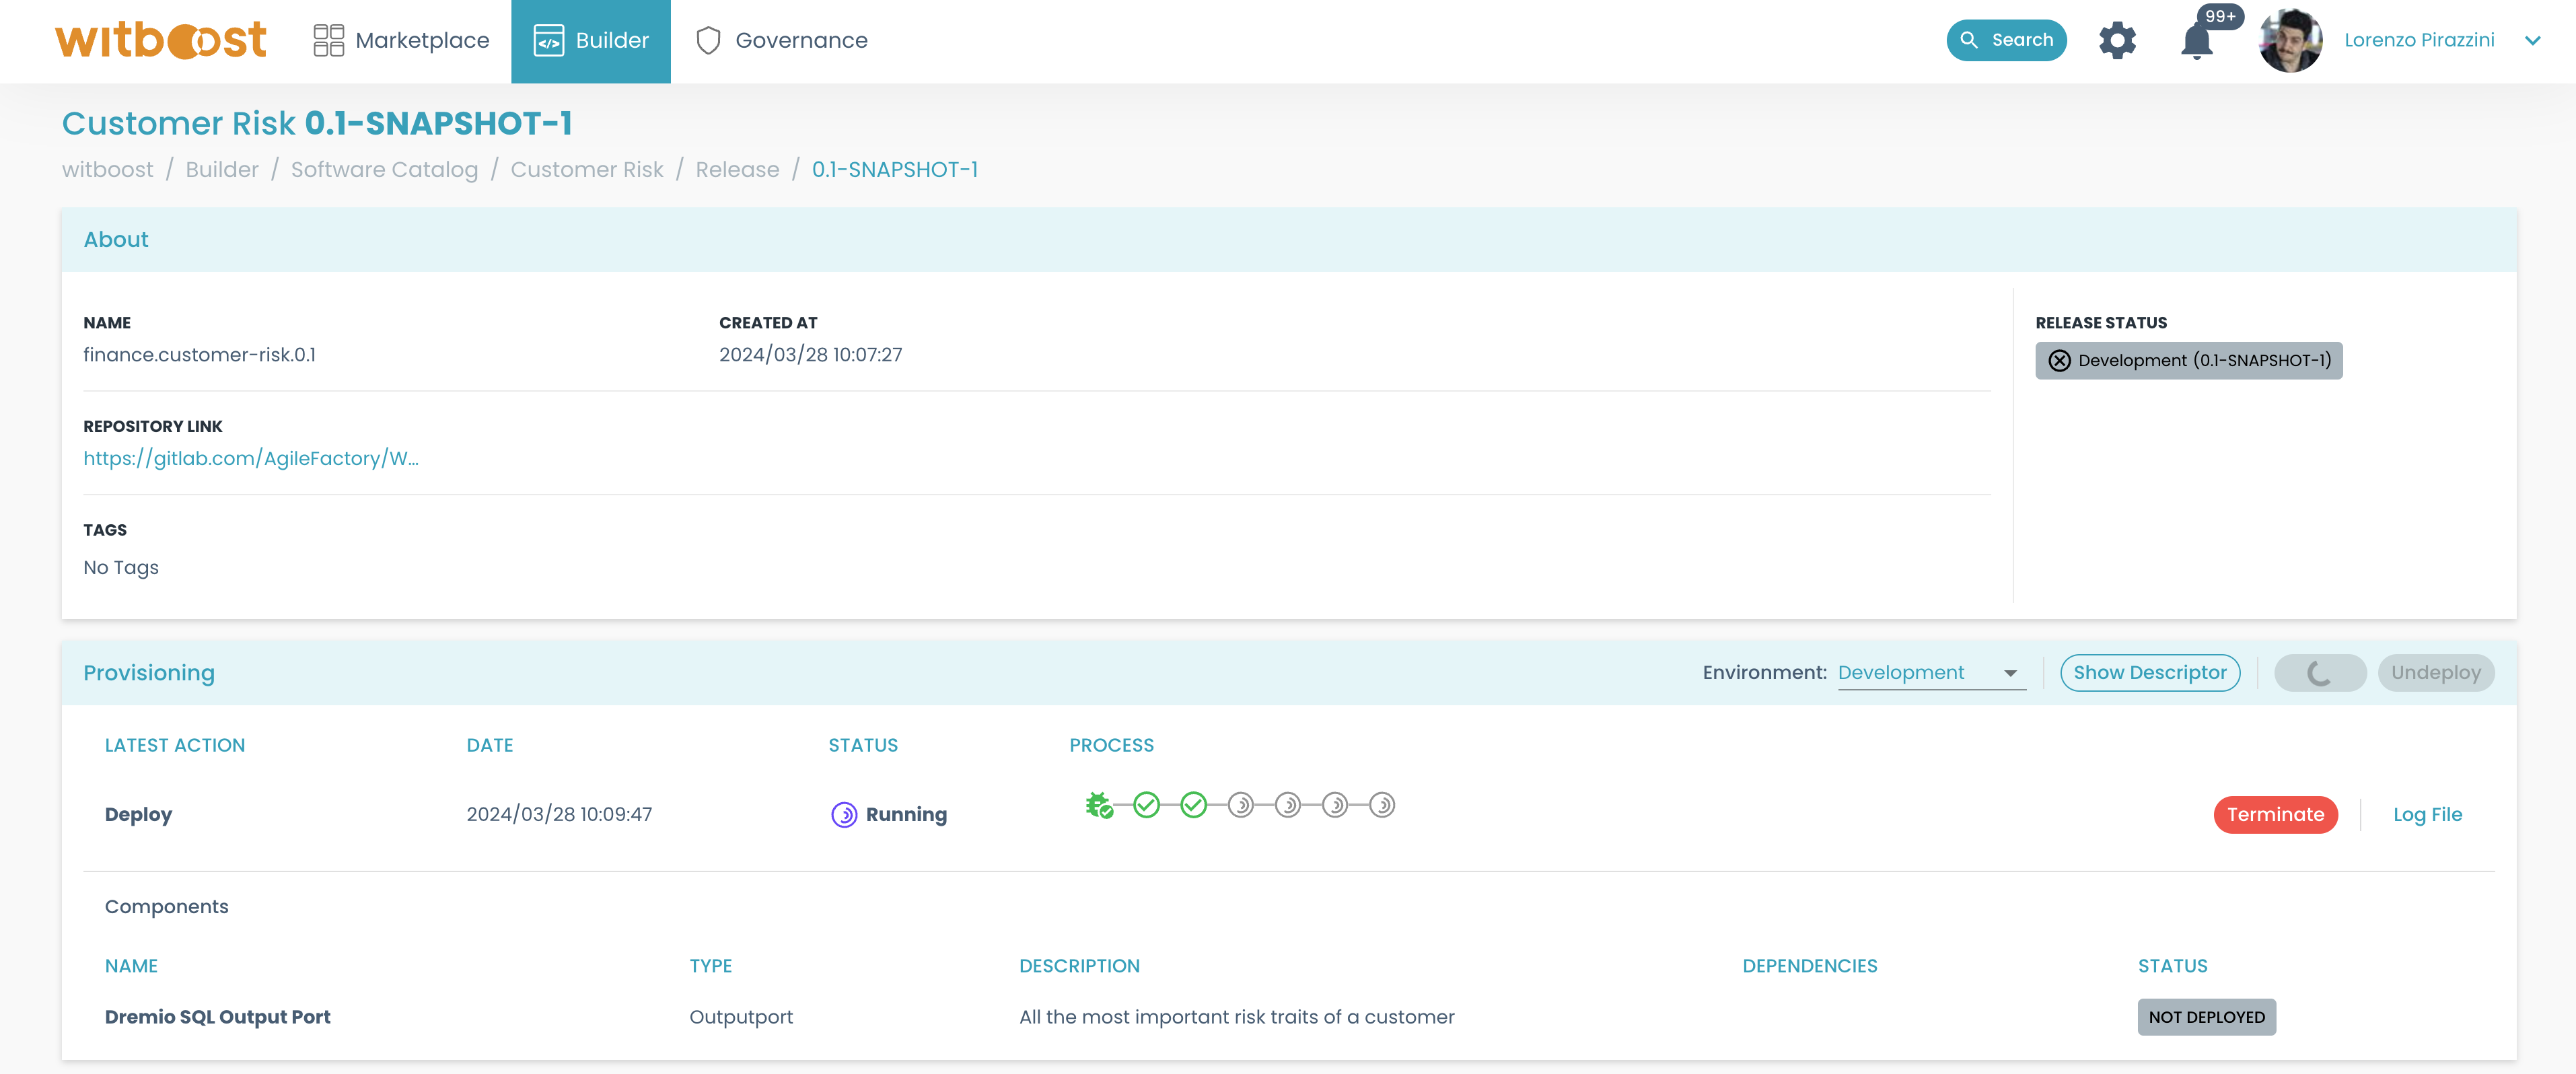
- If everything goes right, you will see all circles turning green, with a checkmark.
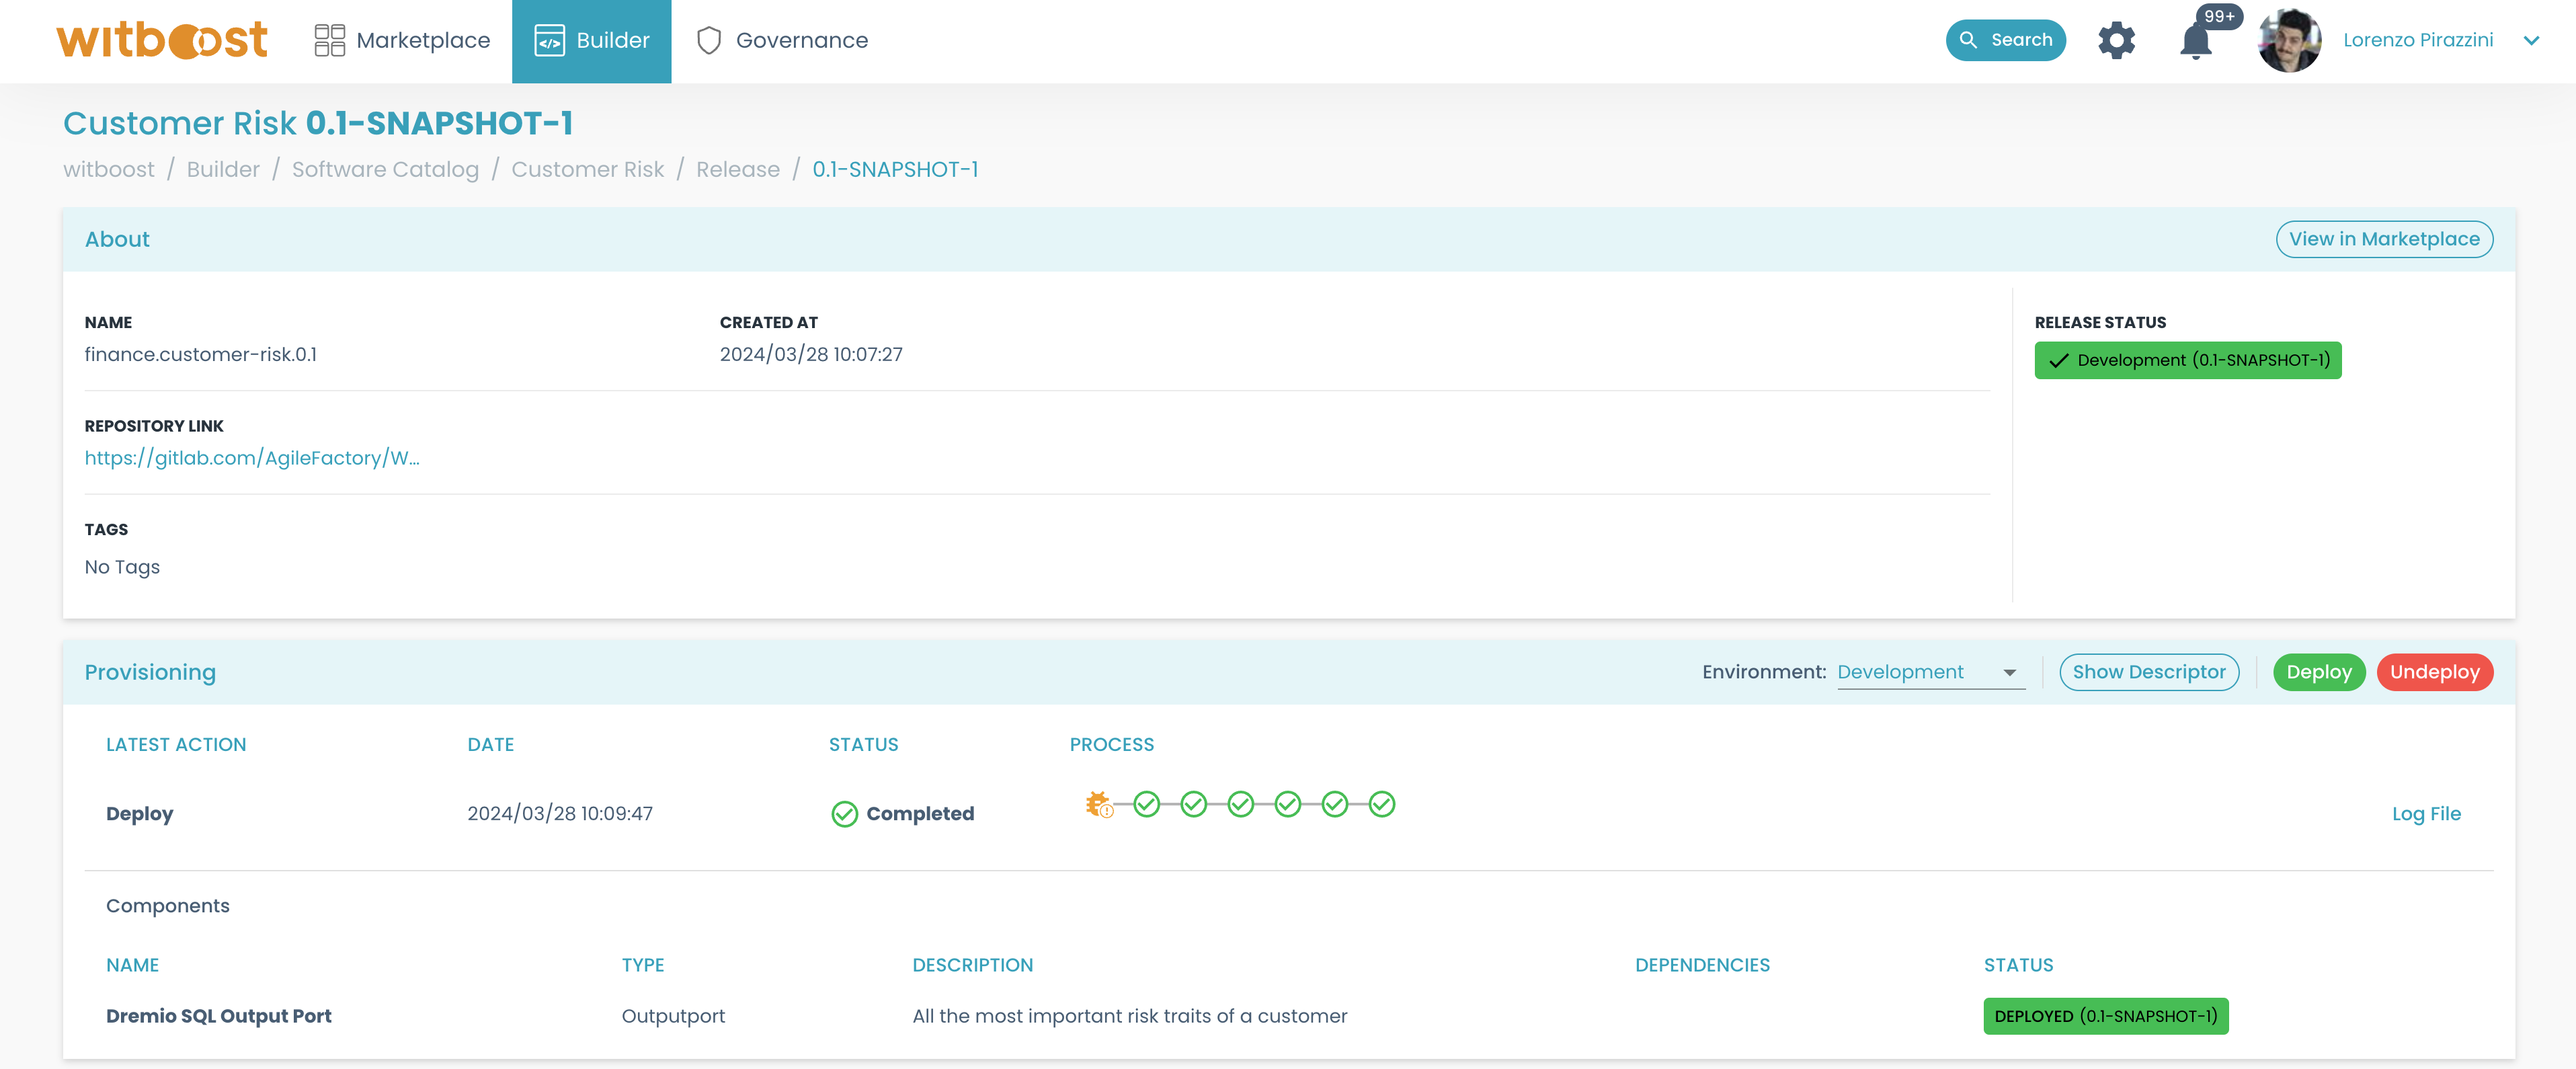
If the deployment is successful, the data product gets published to the marketplace, and it's available to be consumed by other domains: you can click on the link that appears on the About card to see it on the marketplace directly.
If you are not happy with your current release of the Data Product, or you deployed something misconfigured, or simply you want to change some logic, you will need to first make changes on the components or to the data product itself, then, you should update the deployment unit before deploying it again. To update the release, just make your changes, and then click on Update draft release.
If you want more details about releases and update operations, take a look at the deployment guide
Consuming Data Products
We have briefly seen how to build and work with a Data Product from scratch. Then we understood that after a deployment is performed, our data product is published in the marketplace to be consumed by other data teams within the organization.
How can we consume a Data Product in witboost?
To do so, we will use the Marketplace module:
- Go to
Marketplace>Search. In this page you can search for a specific data product by typing some keywords in the search bar, or go directly to the Search Results page.
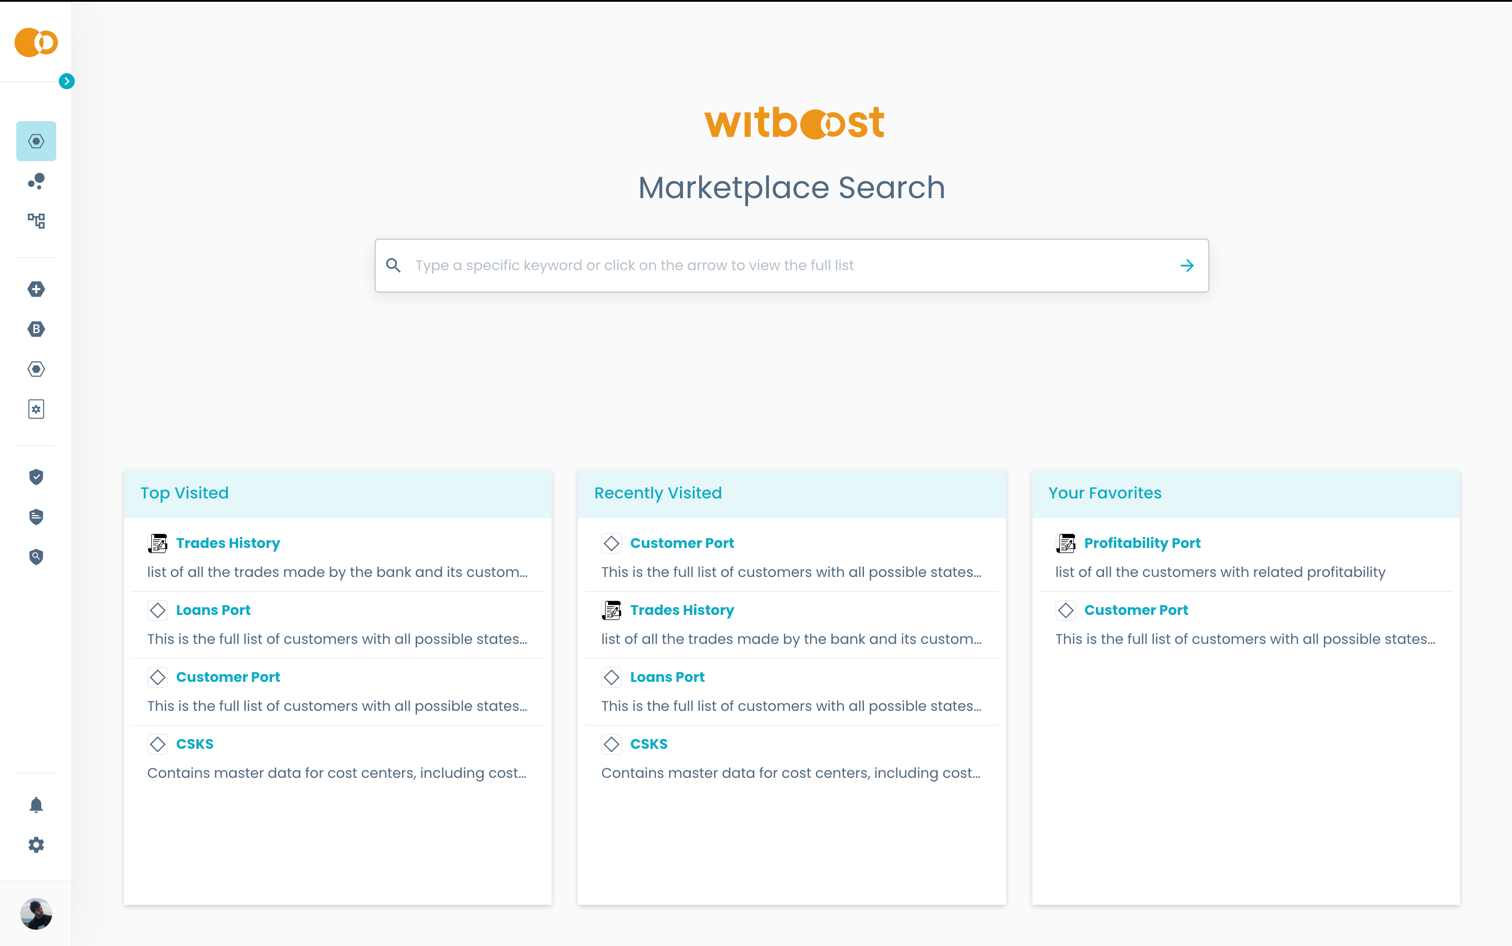
In the Search Results page you can further refine your search by using the filters on the left side of the page.
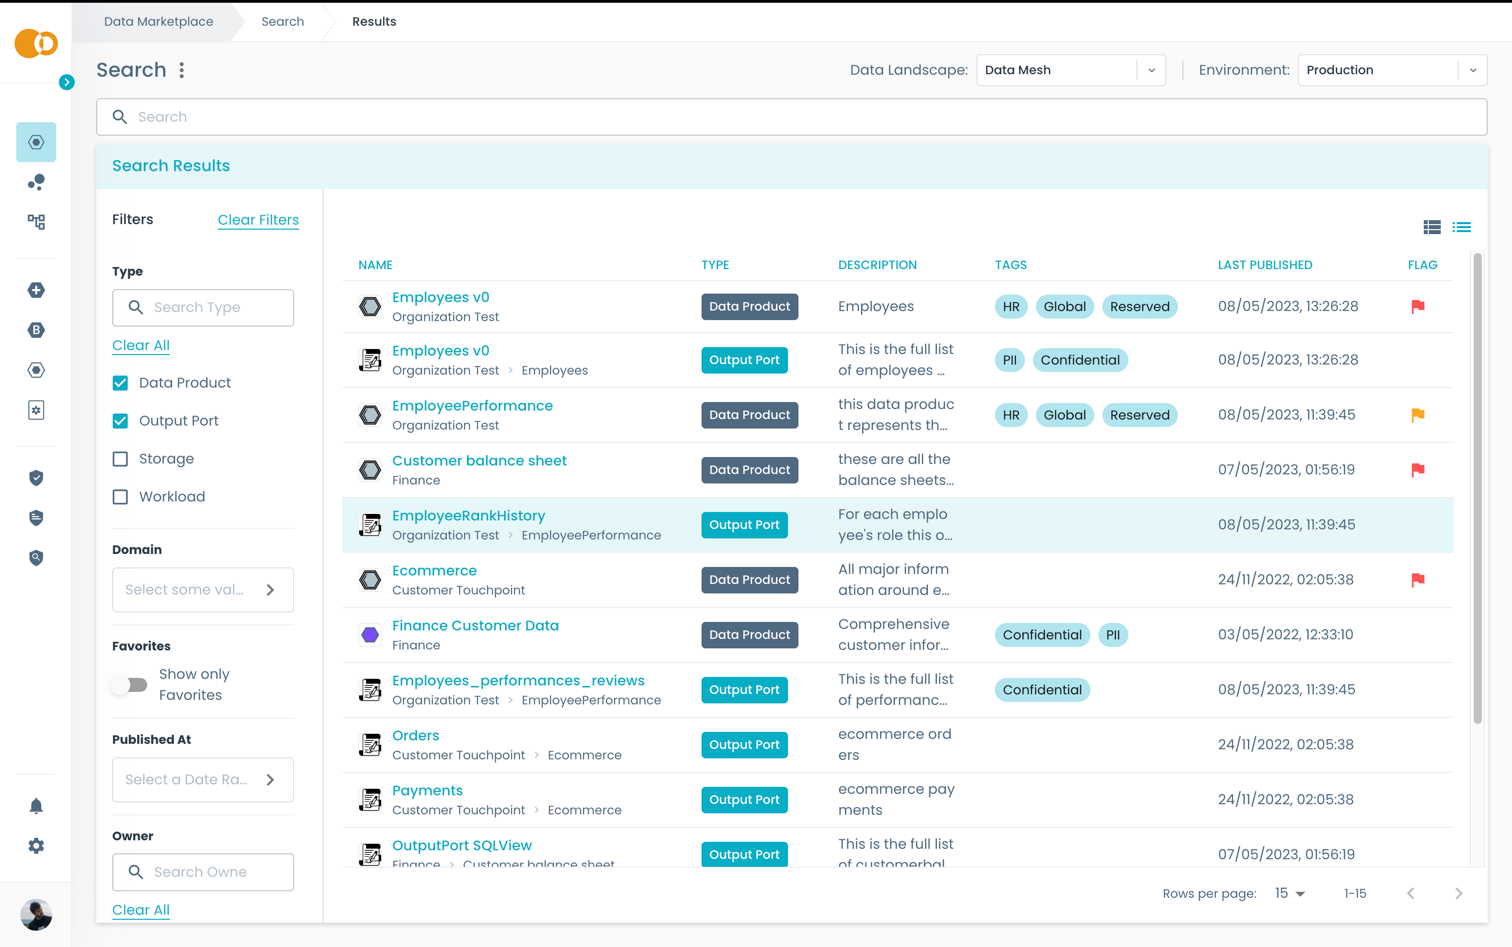
OR
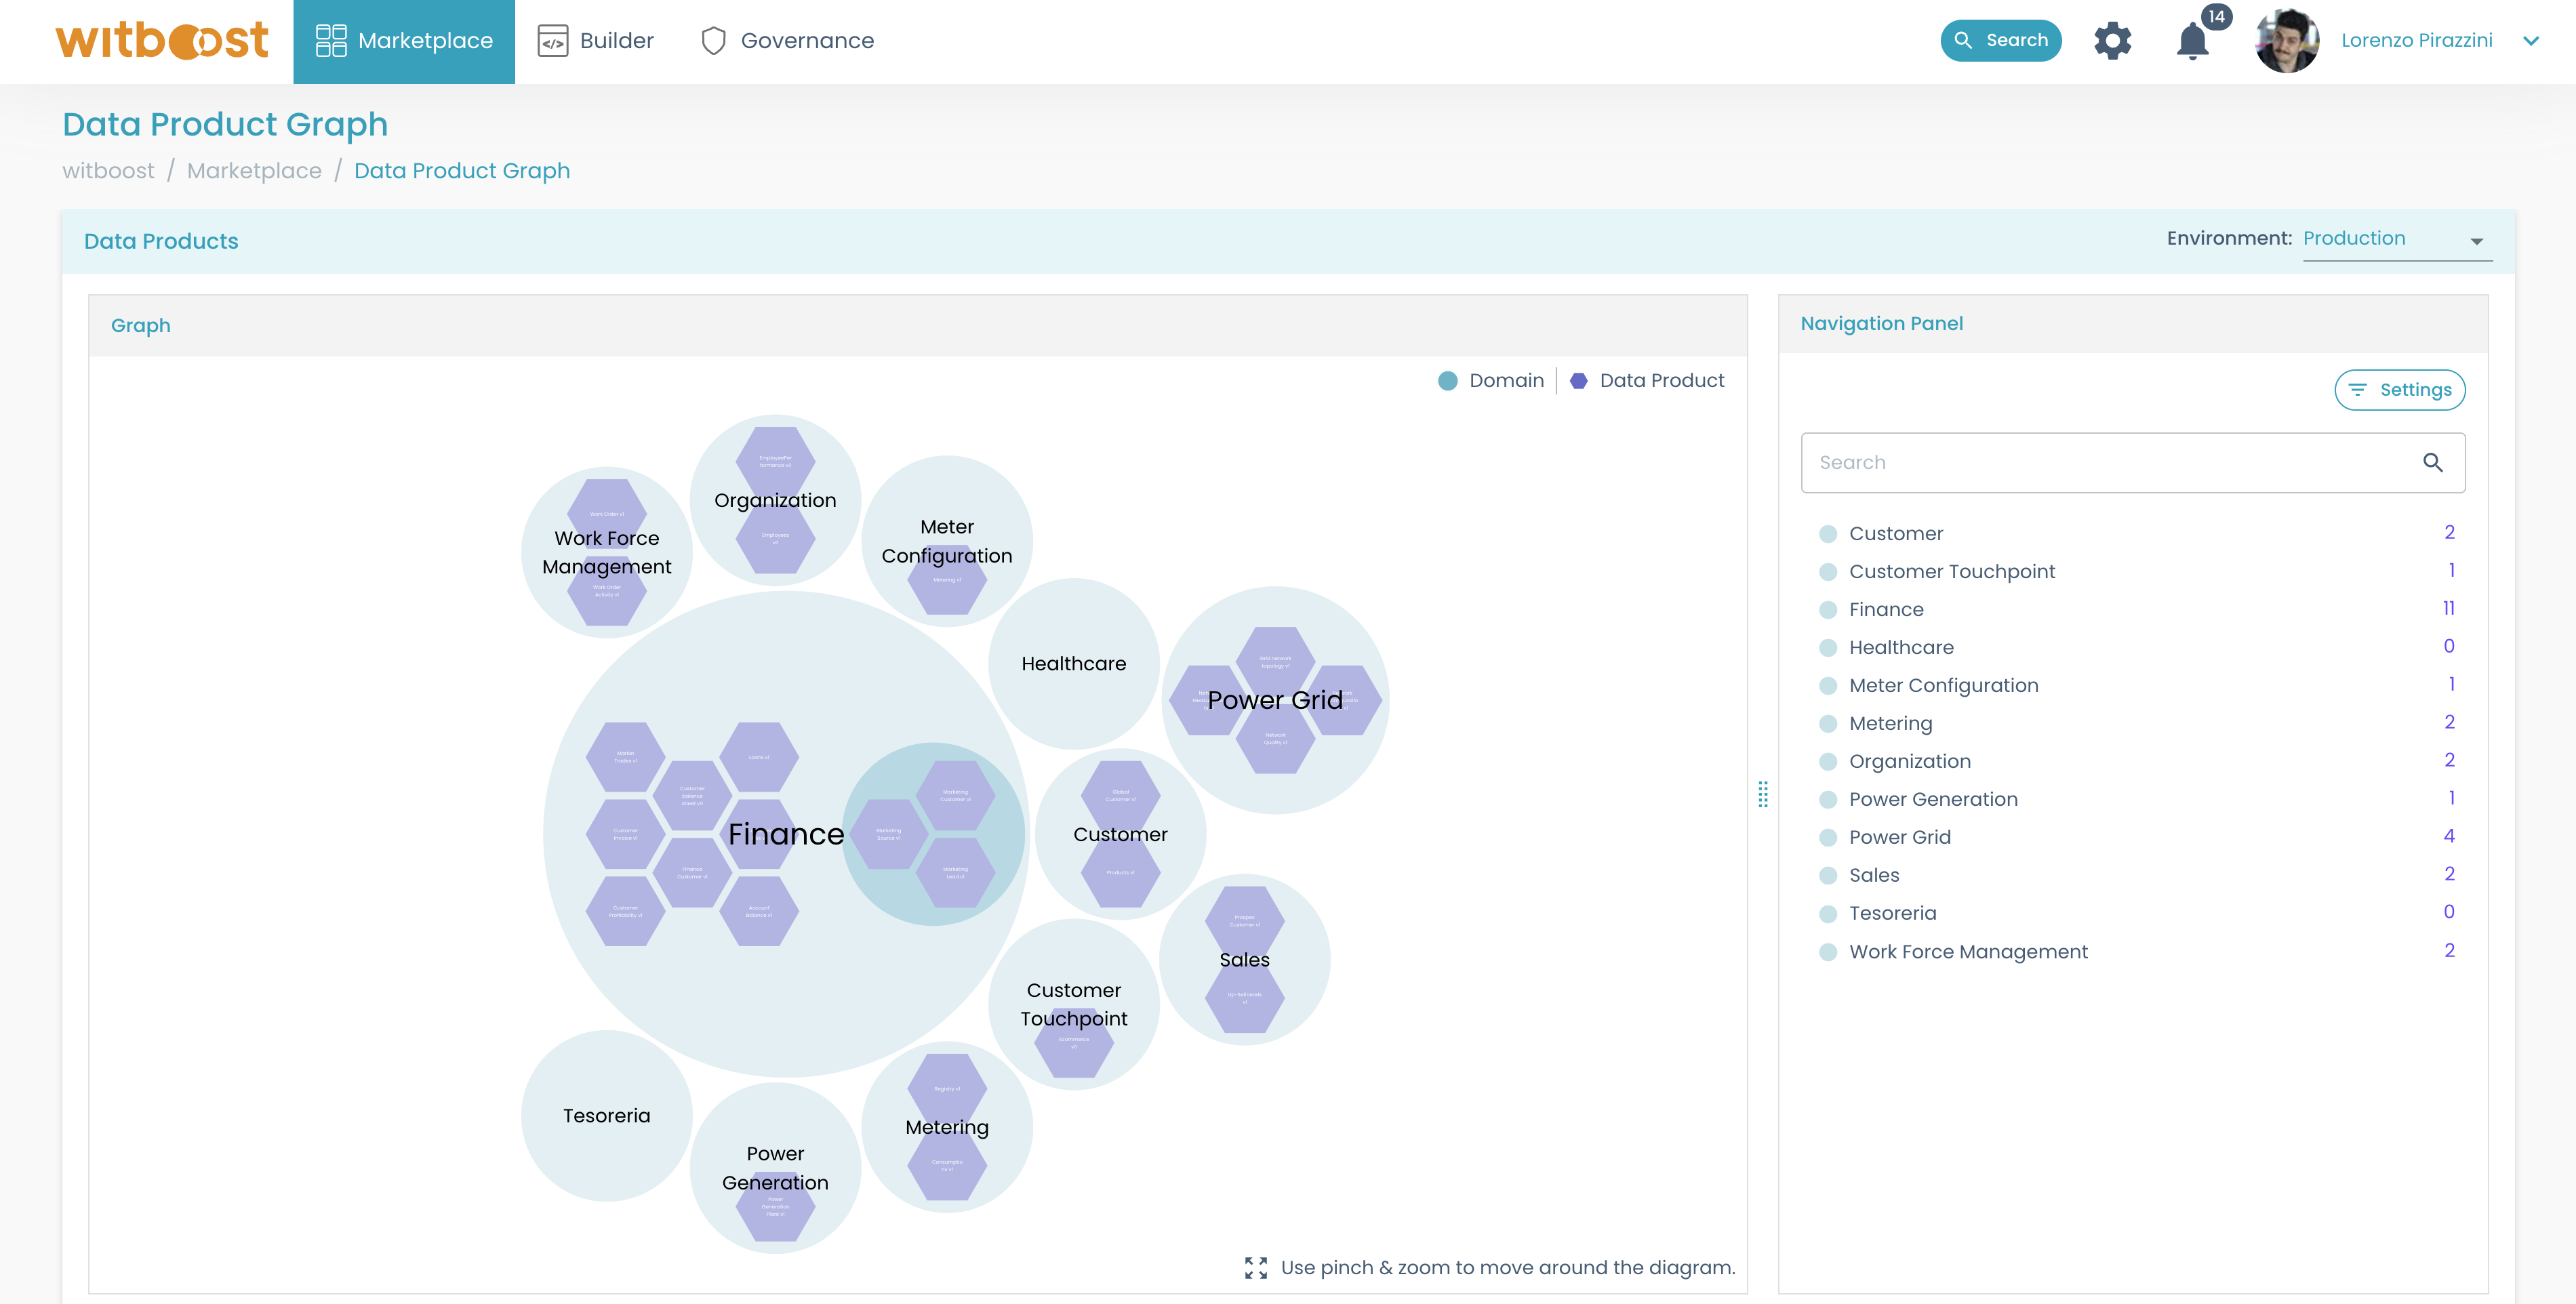
- Go to
Marketplace>Visual Discovery. The graph visualization shows all relationships between the data products published within your organization.
- Click on the data product you are interested in. In this example, we will consider the
Finance Customerdata product for the production environment.
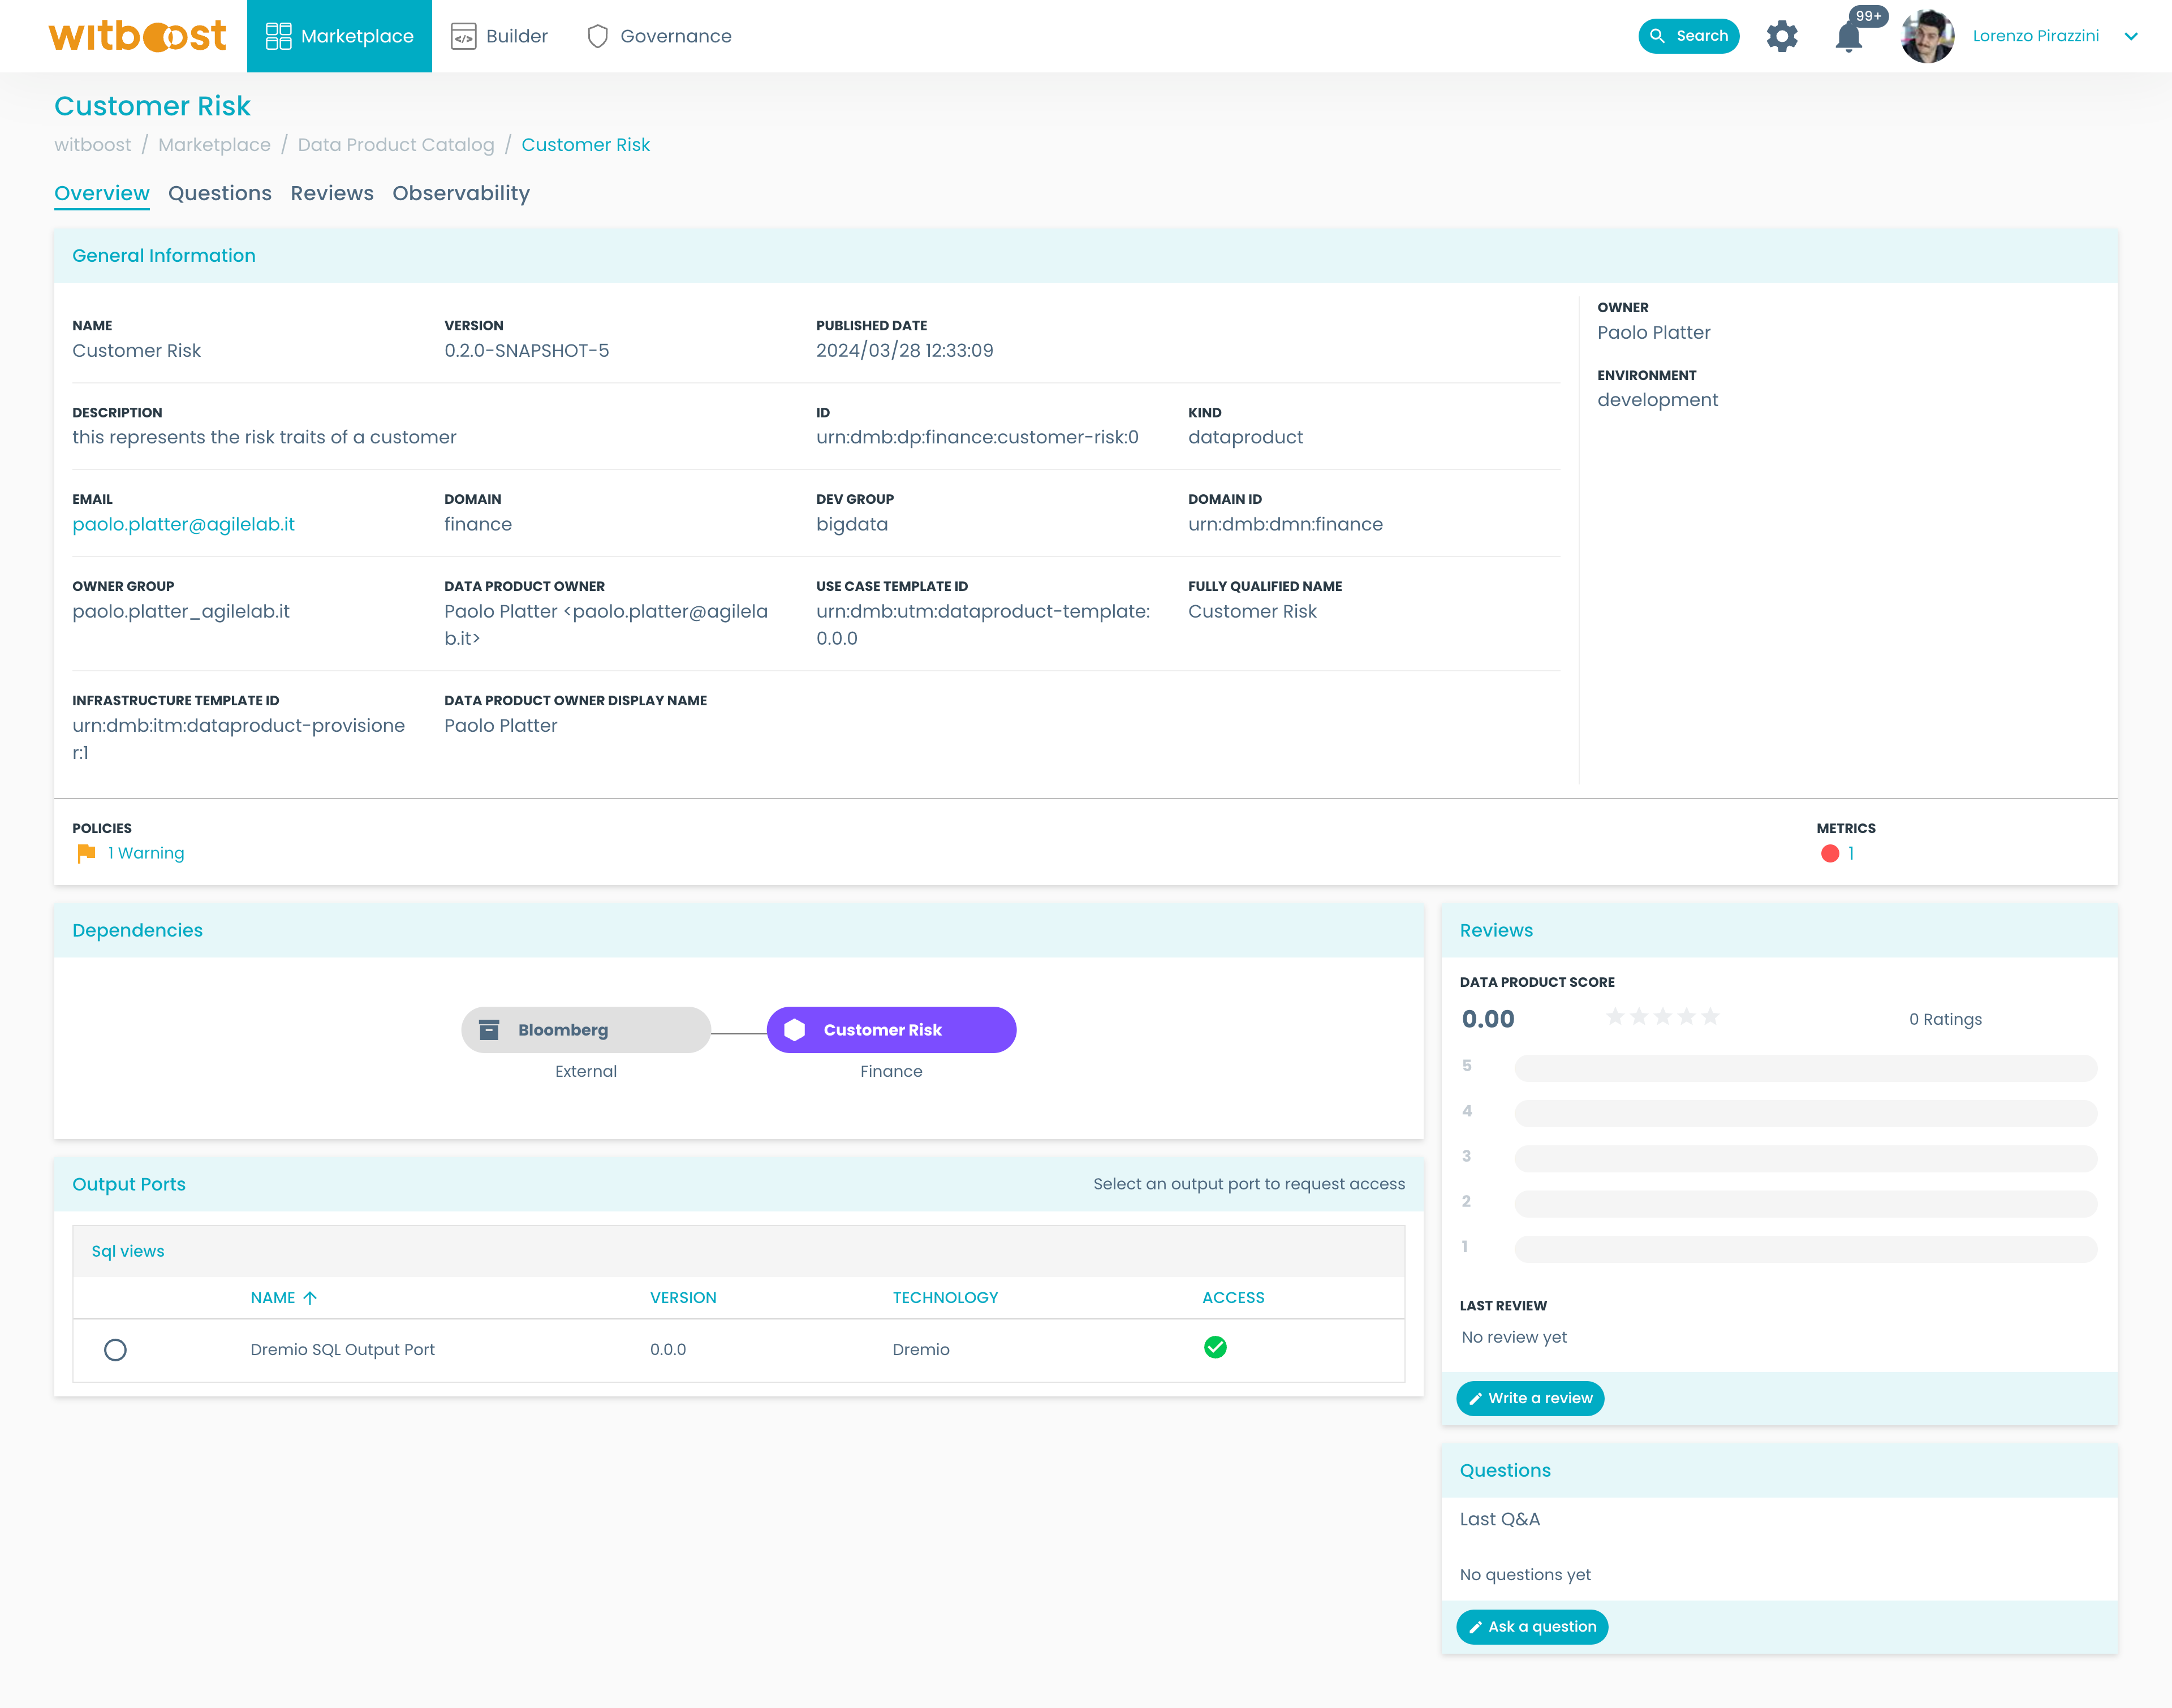
From this page, you will have a set of useful information like general information, dependencies, reviews, questions and answers and available output ports.
We are interested in consuming this data product. Let's get some information about the available output ports. To do so:
- Scroll down to the
Output Portspanel, here you will see the list of available output ports for the data product.
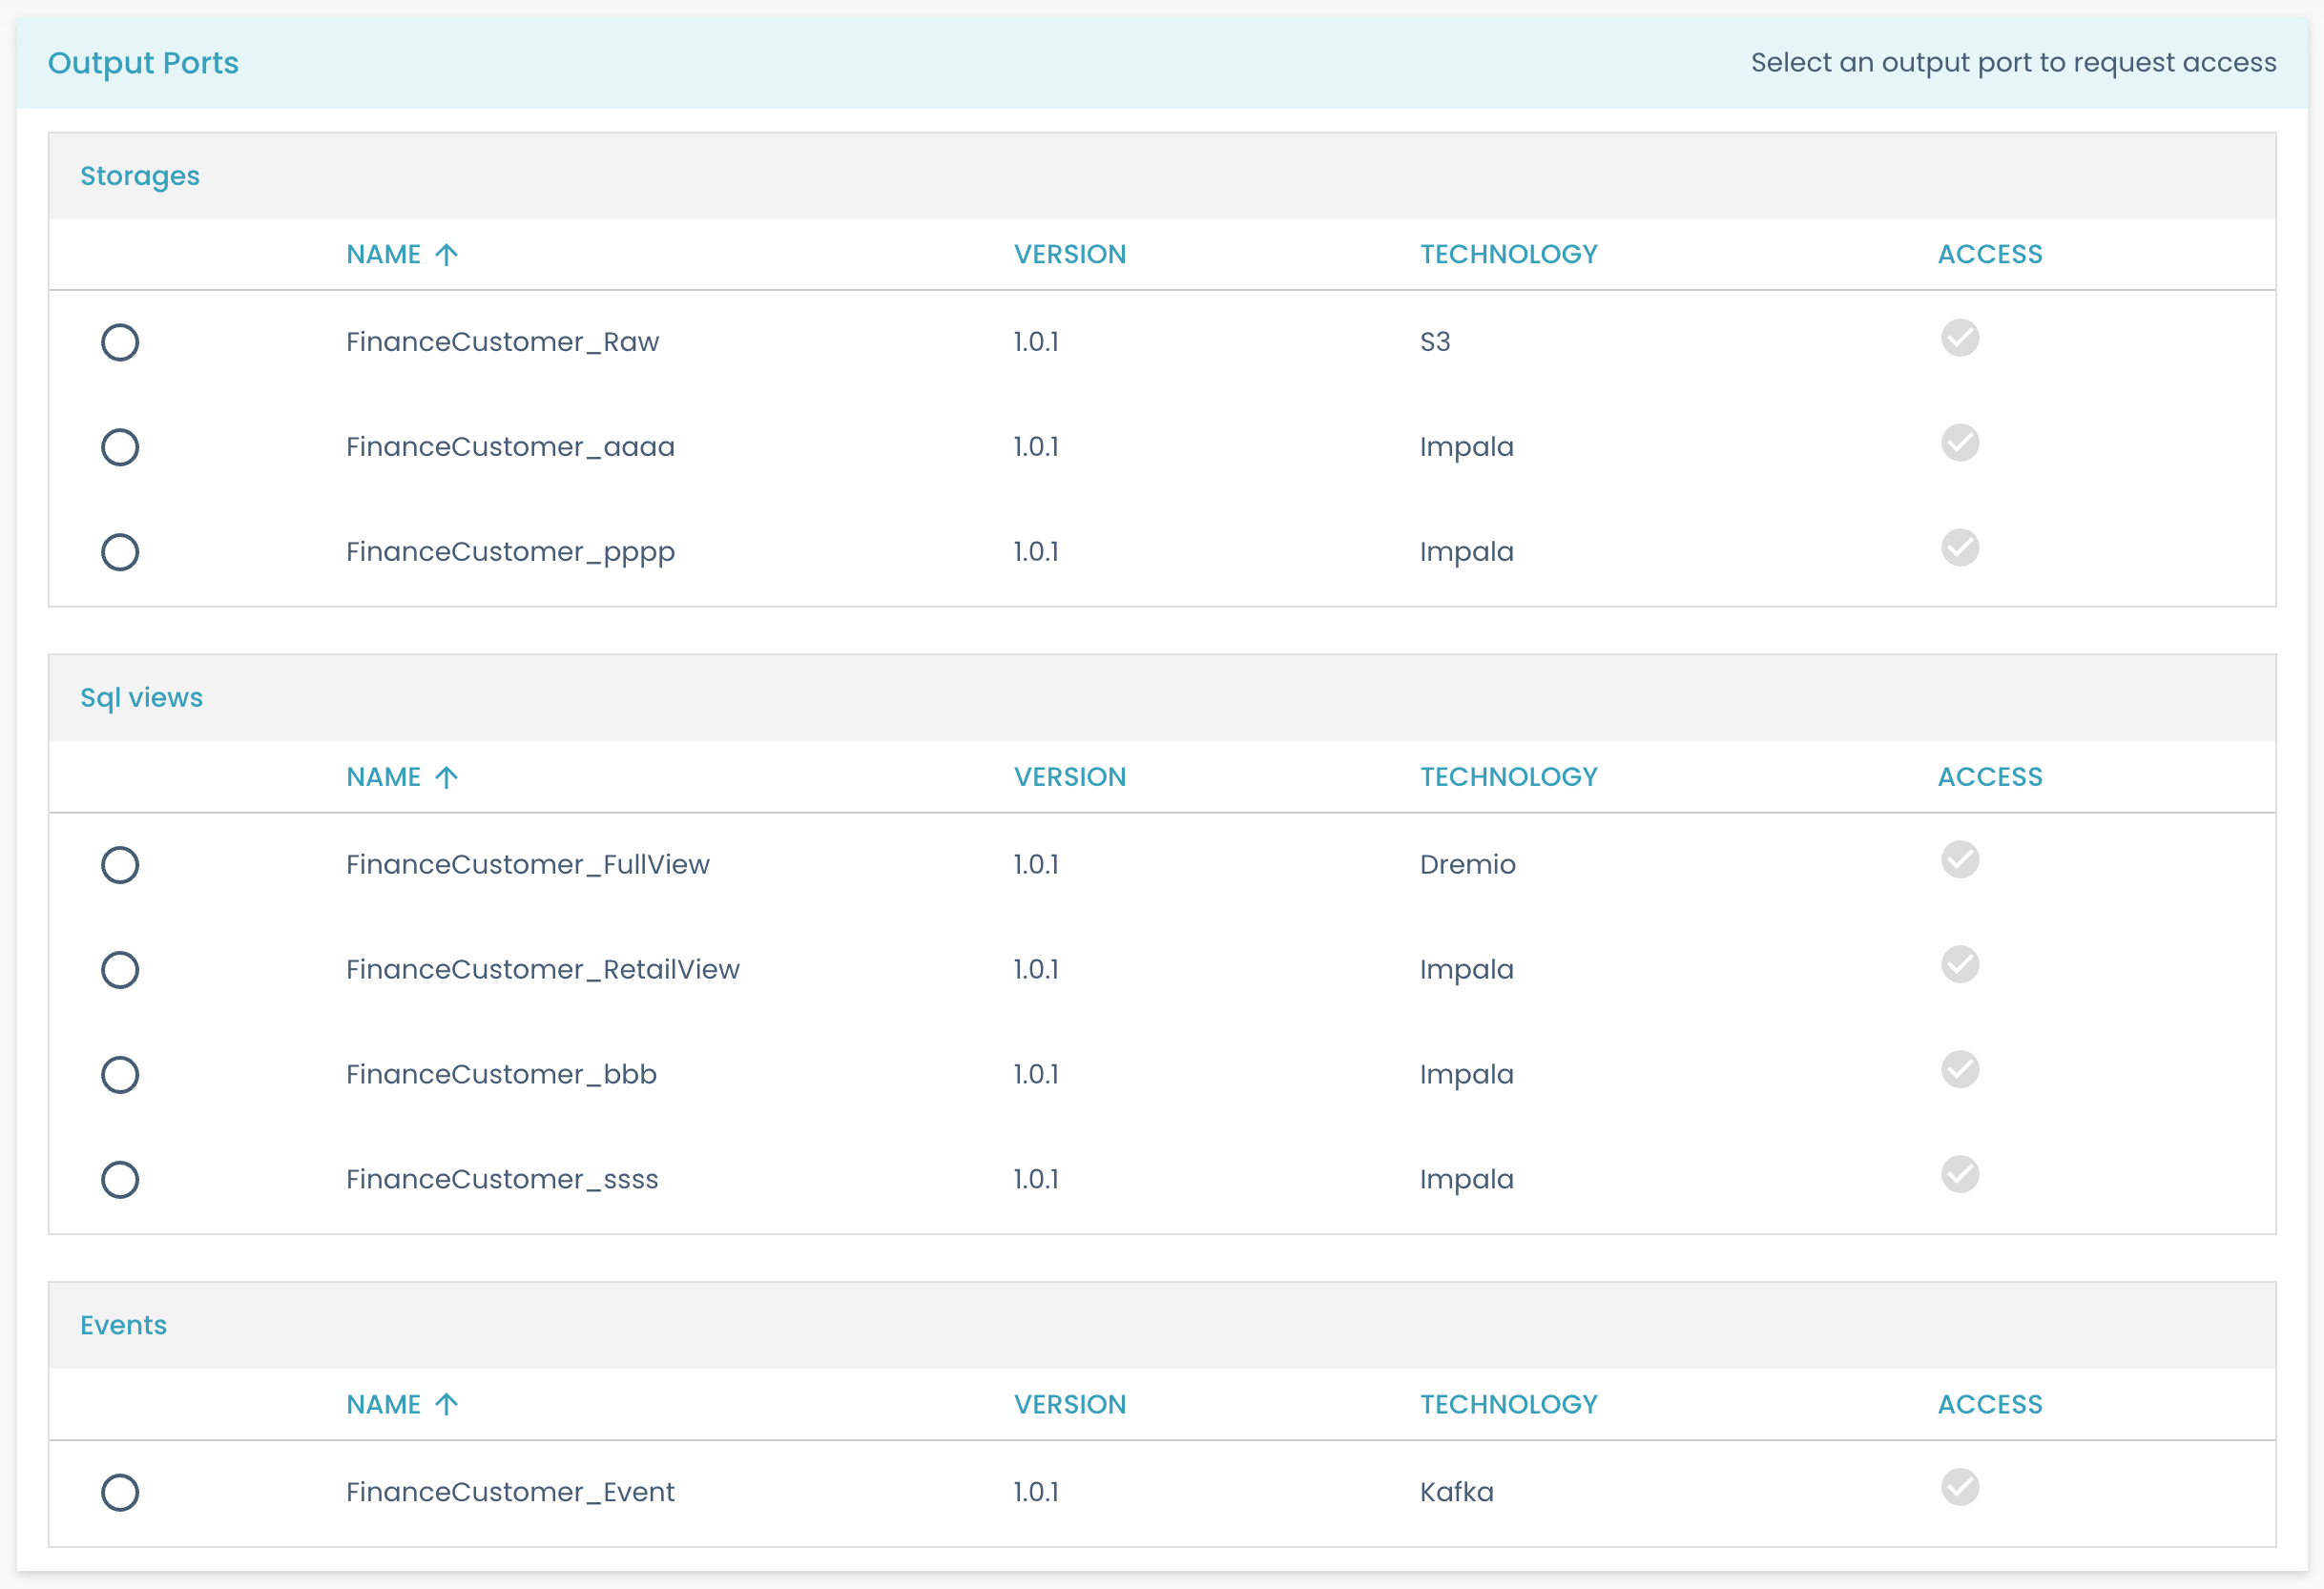
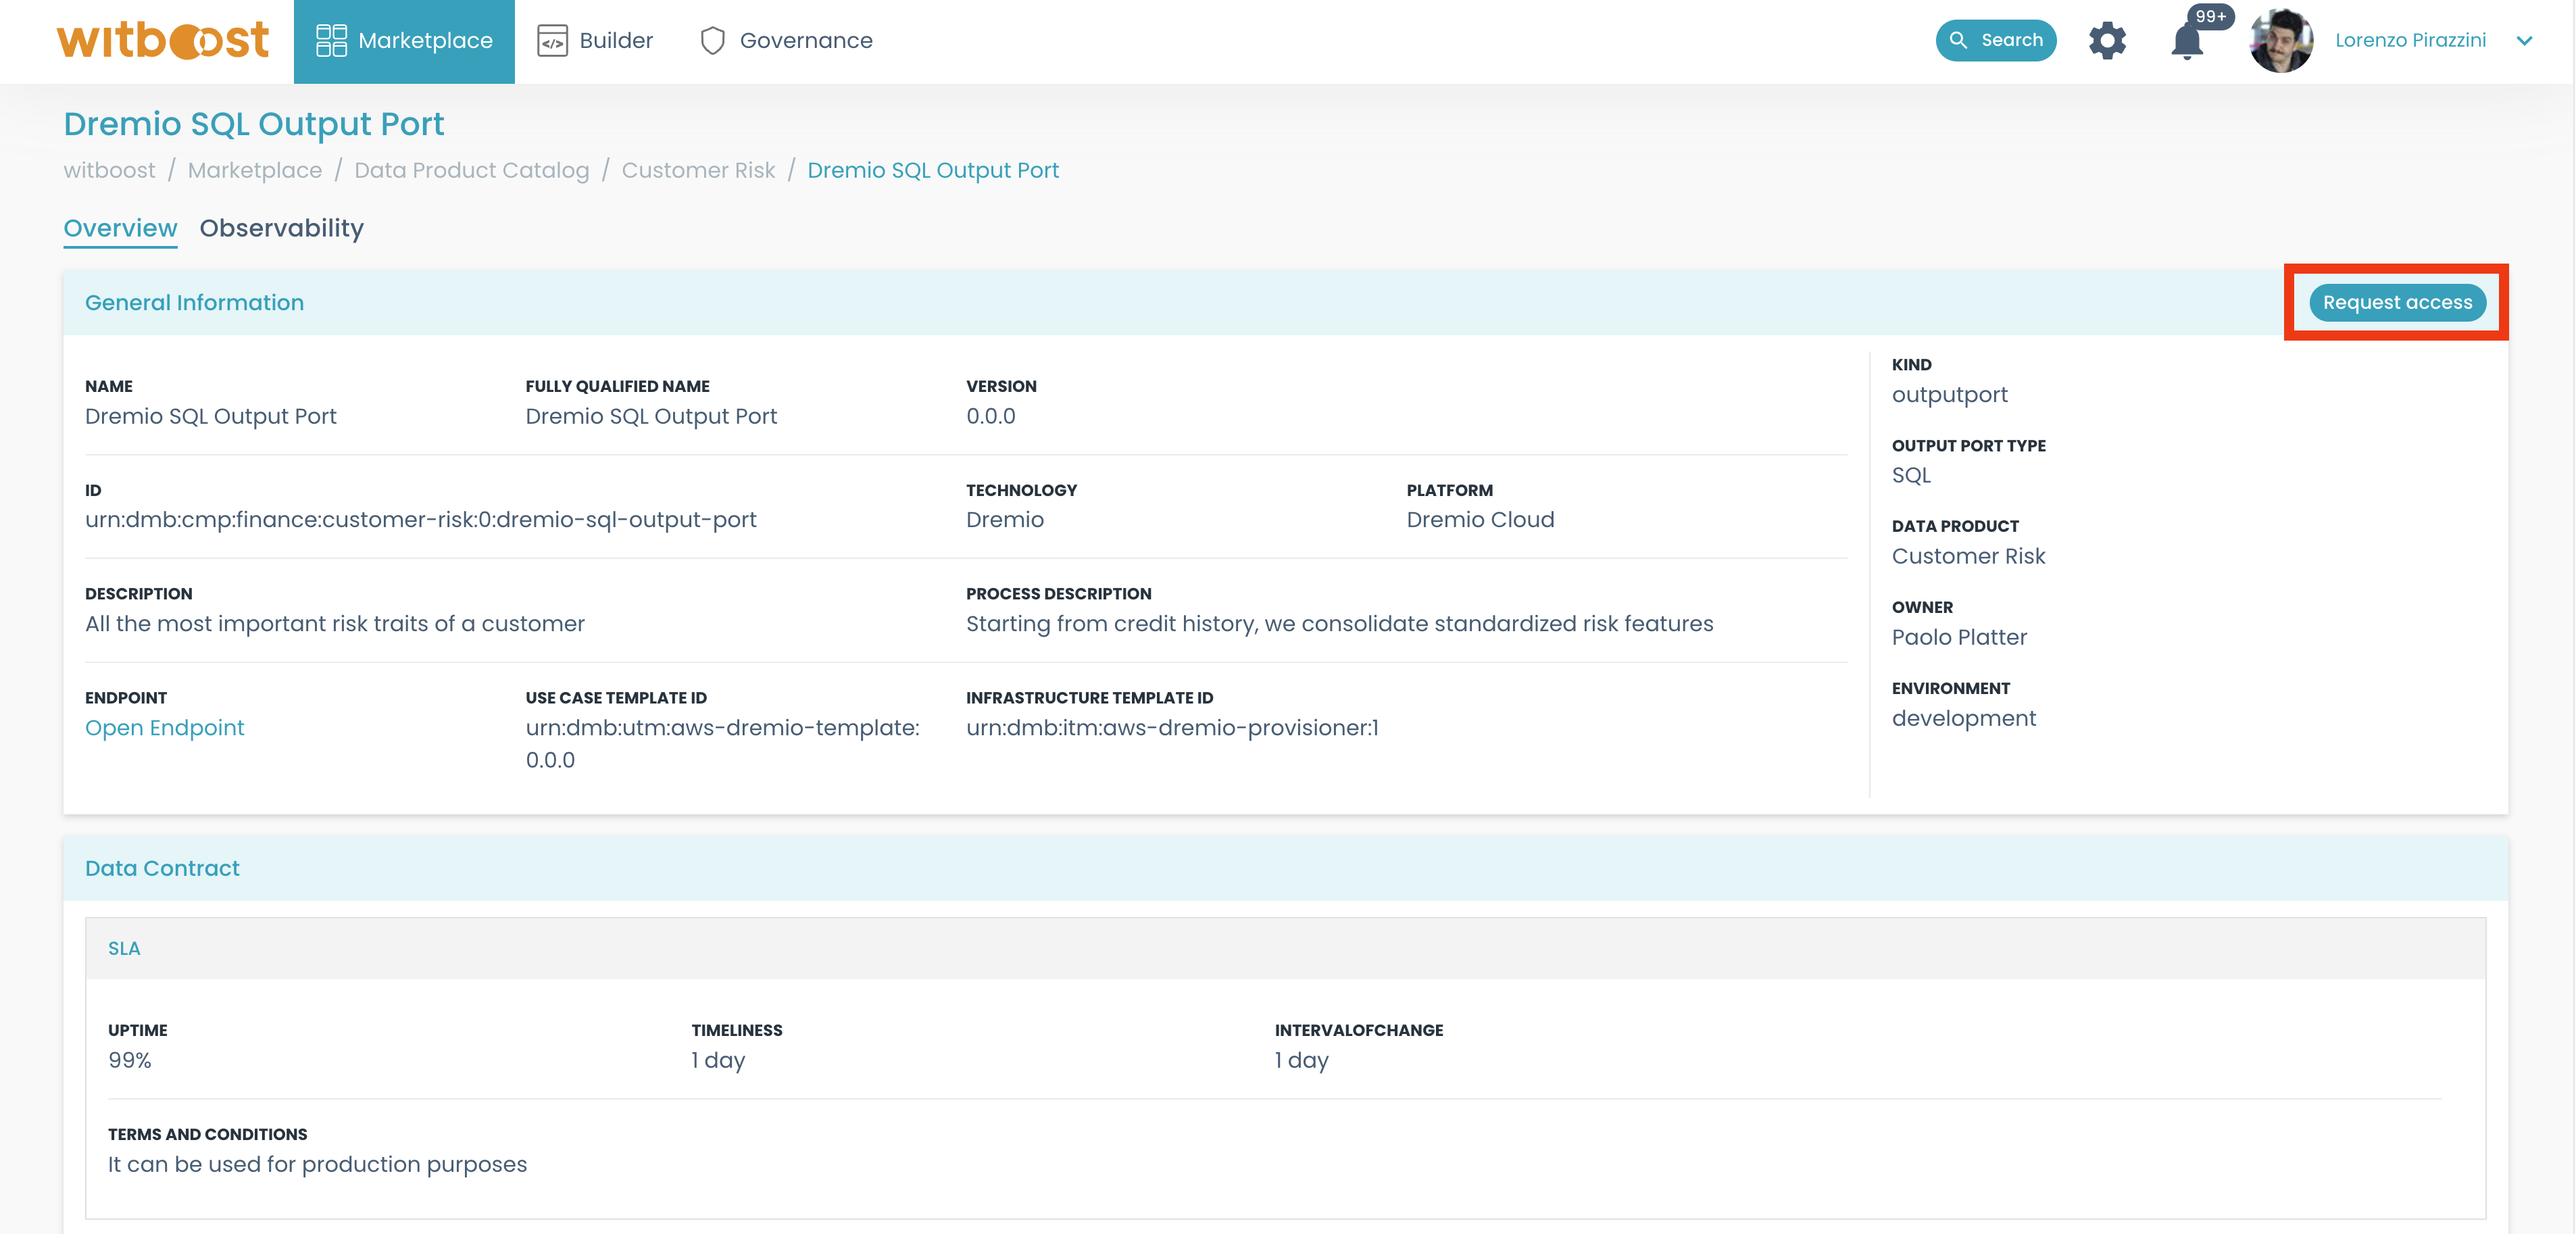
- To get some details on any output port, just click on it. You will land on the output port's details page, with some insightful information.
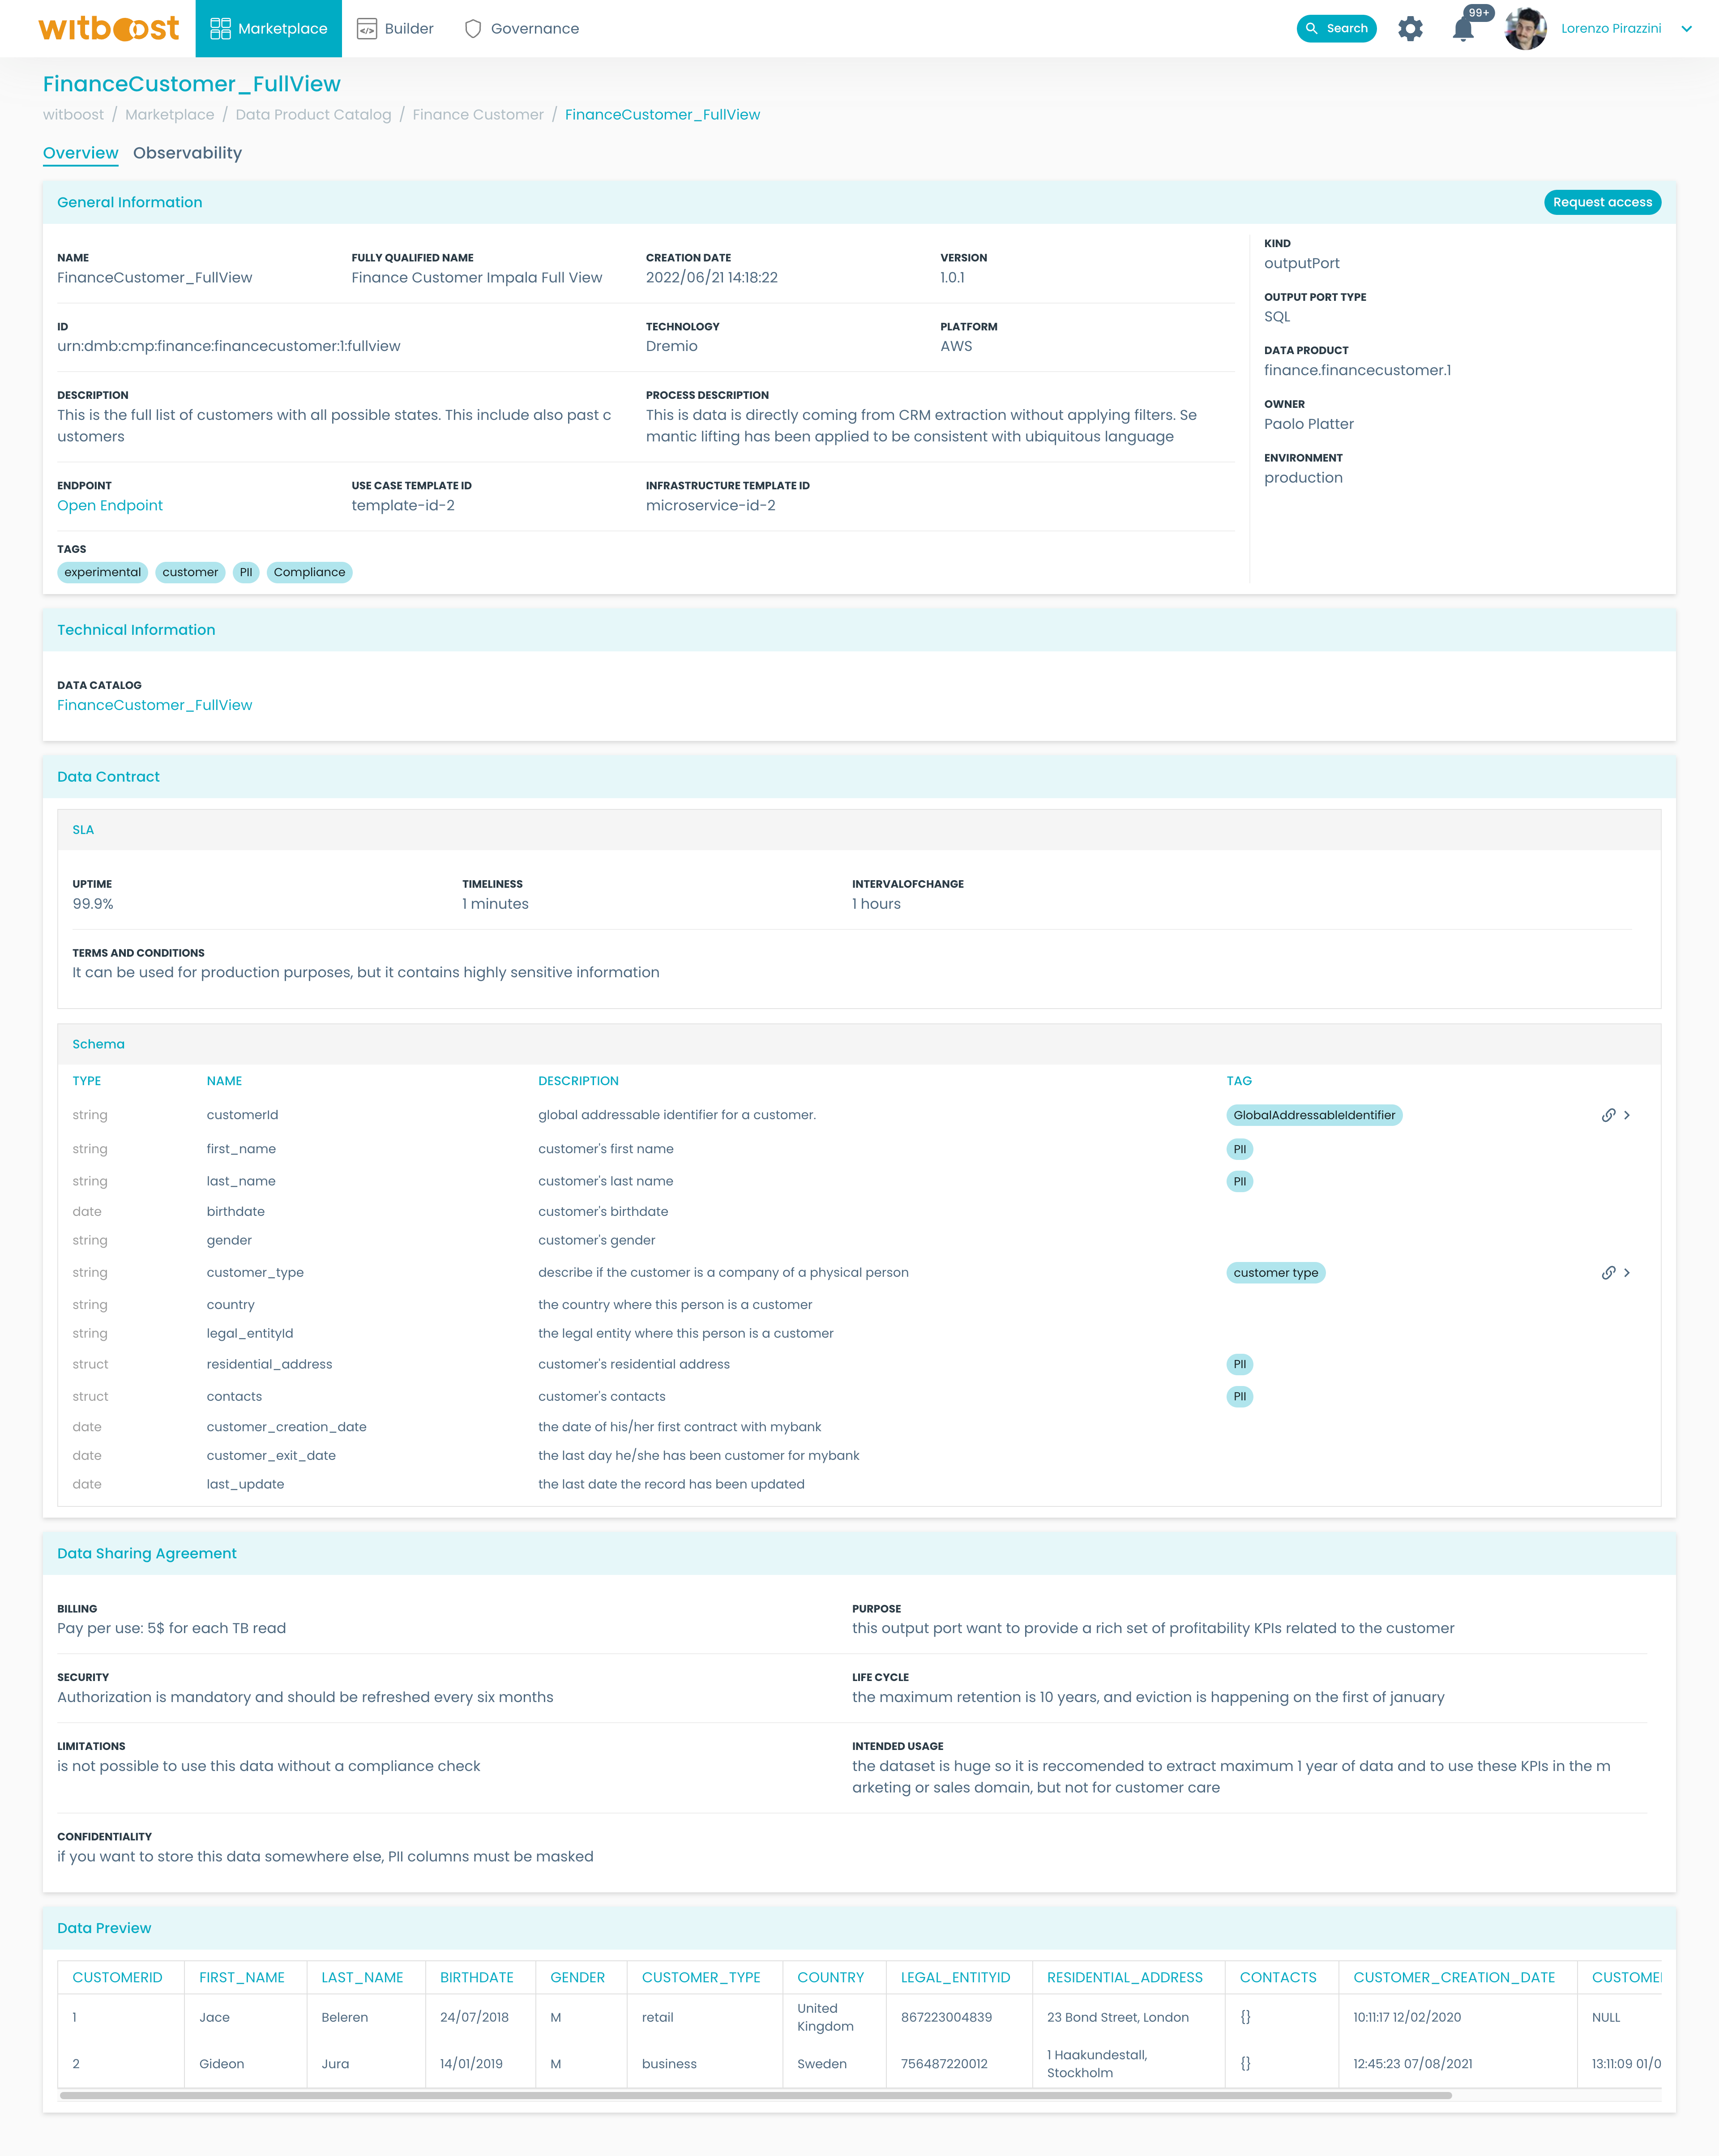
- We decided to consume this output port. To do so, let's request access to it, by clicking on the
Request accessbutton:
- You will be prompted to insert some data to let the Data Product owner be able to grant access to you or your team in case the request is accepted:
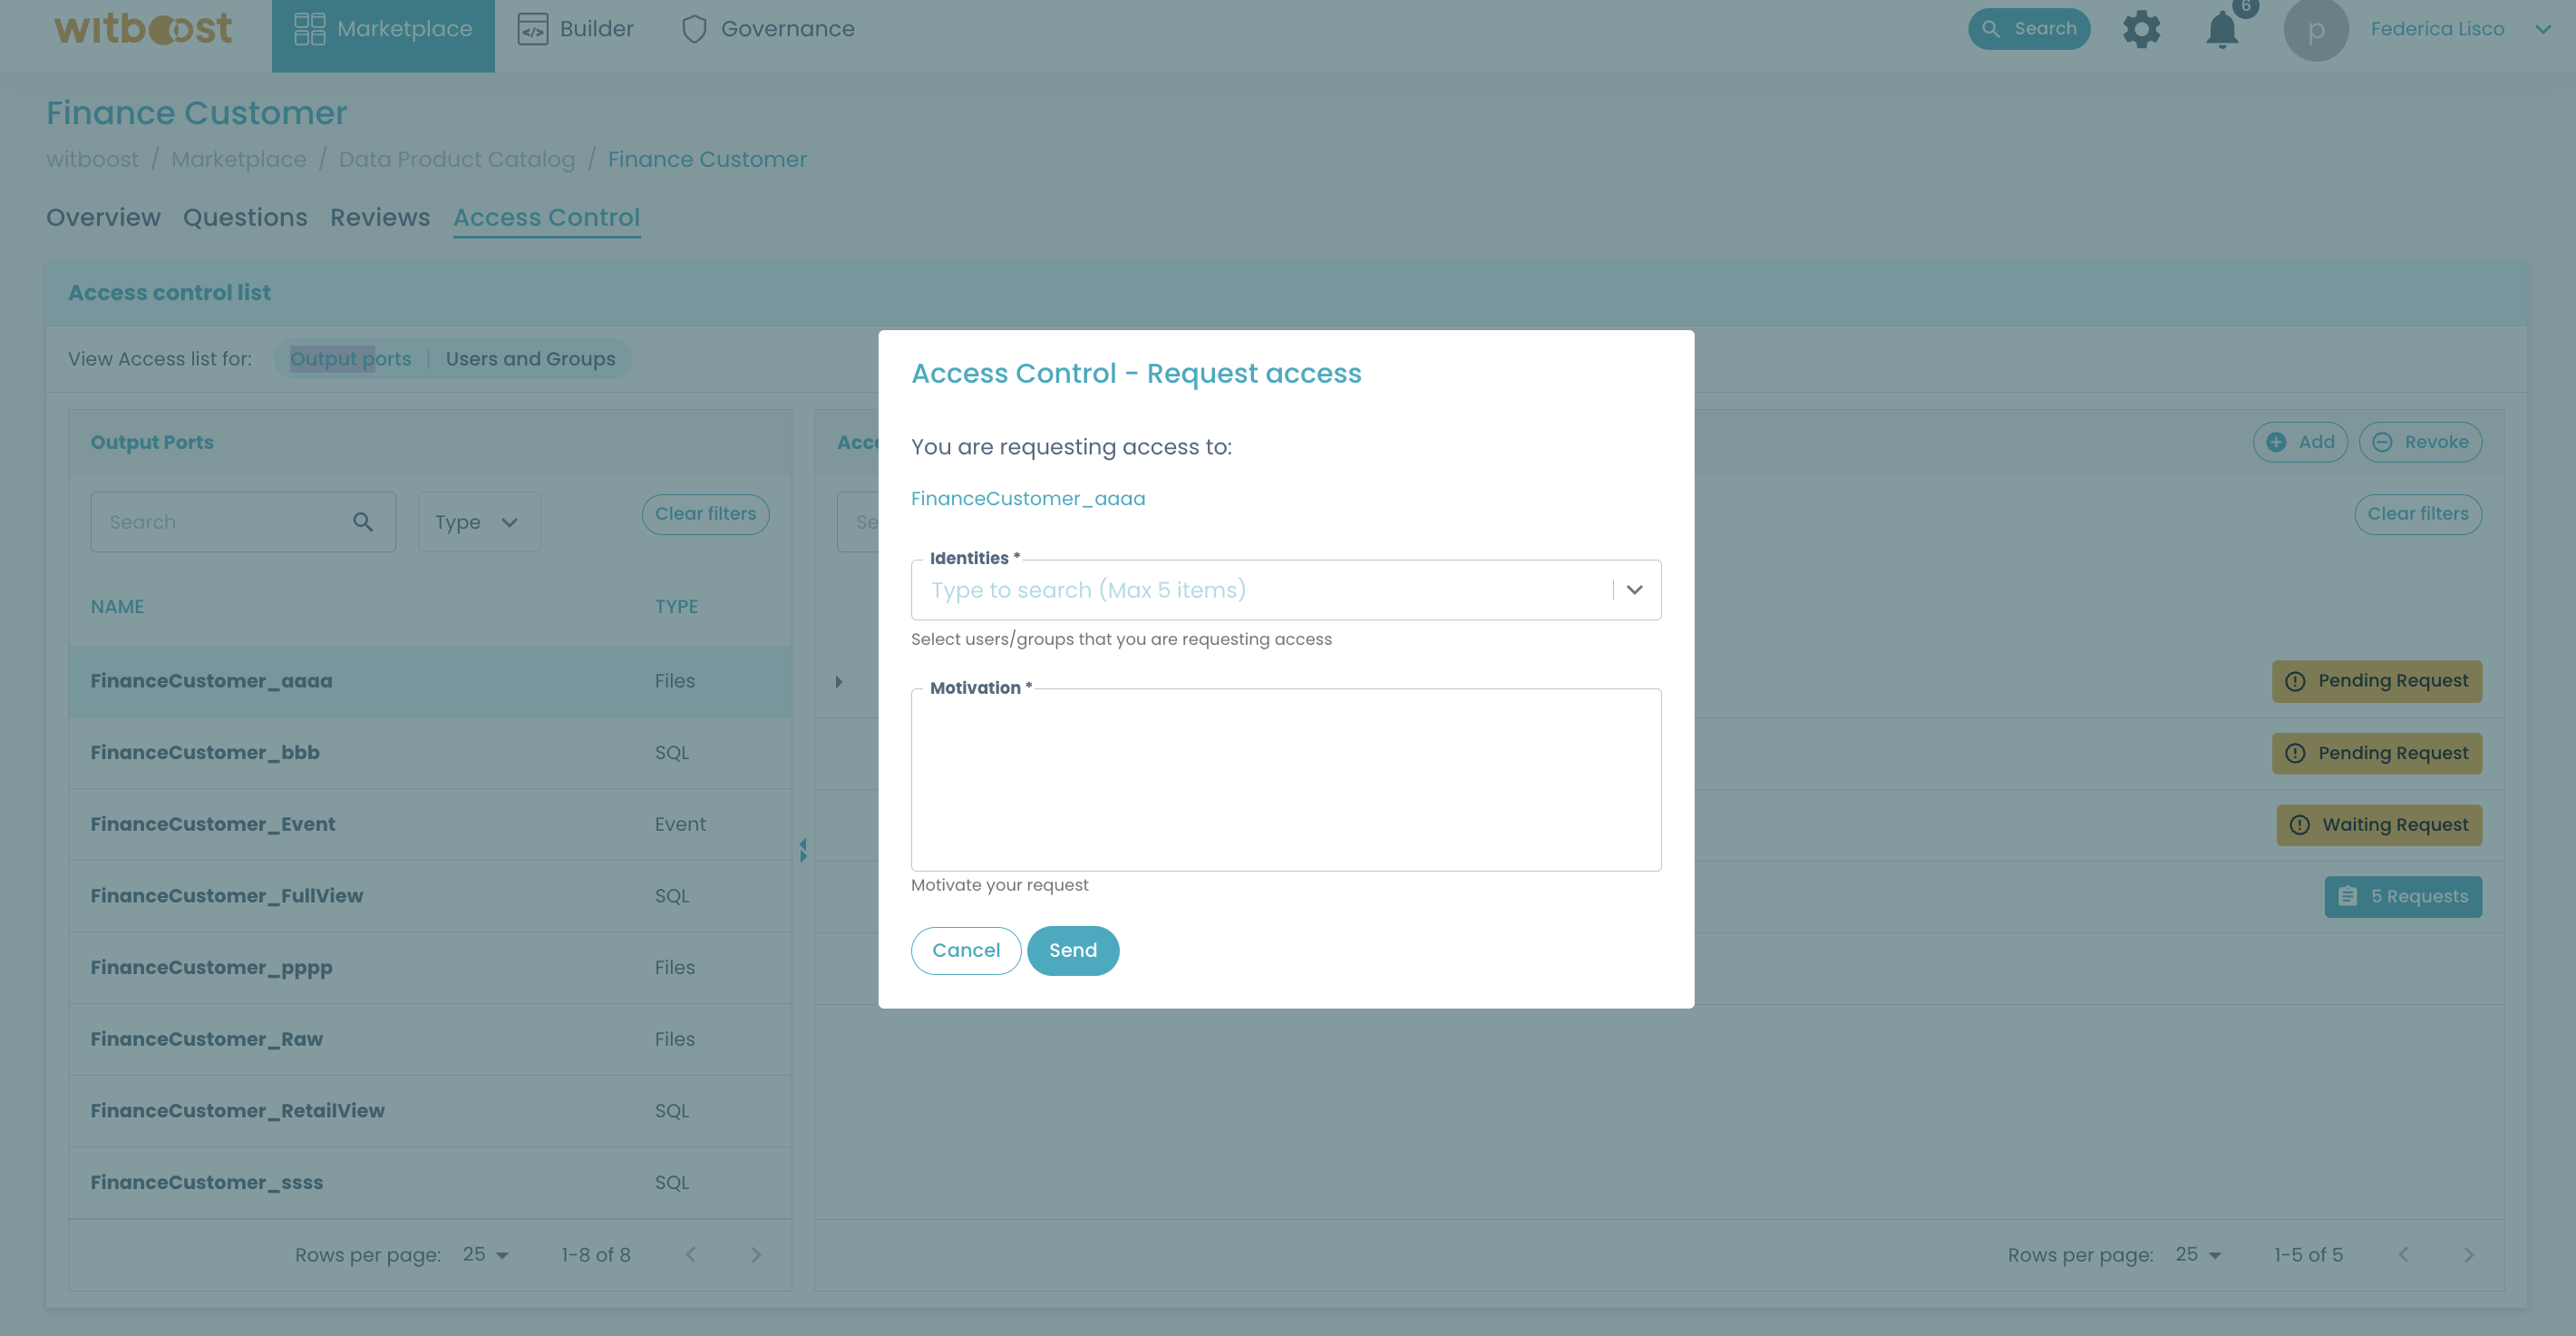
- Click
Sendto finalize the request!
Visualizing our Data Mesh
Graph visualization
The marketplace module gives you the possibility to visualize, in the form of a Graph, all relationships between data
products published in the Marketplace.
This graph visualization is available in Marketplace > Visual Discovery.
Each node of the graph represents a data product. Each circle, instead, is a domain. A circle can then contain other circles (i.e. sub-domains) or nodes (i.e. data products).
As you can notice, no relationship is represented in the graph yet, hence there is no edge connecting one or more nodes.
Now, click on any node:
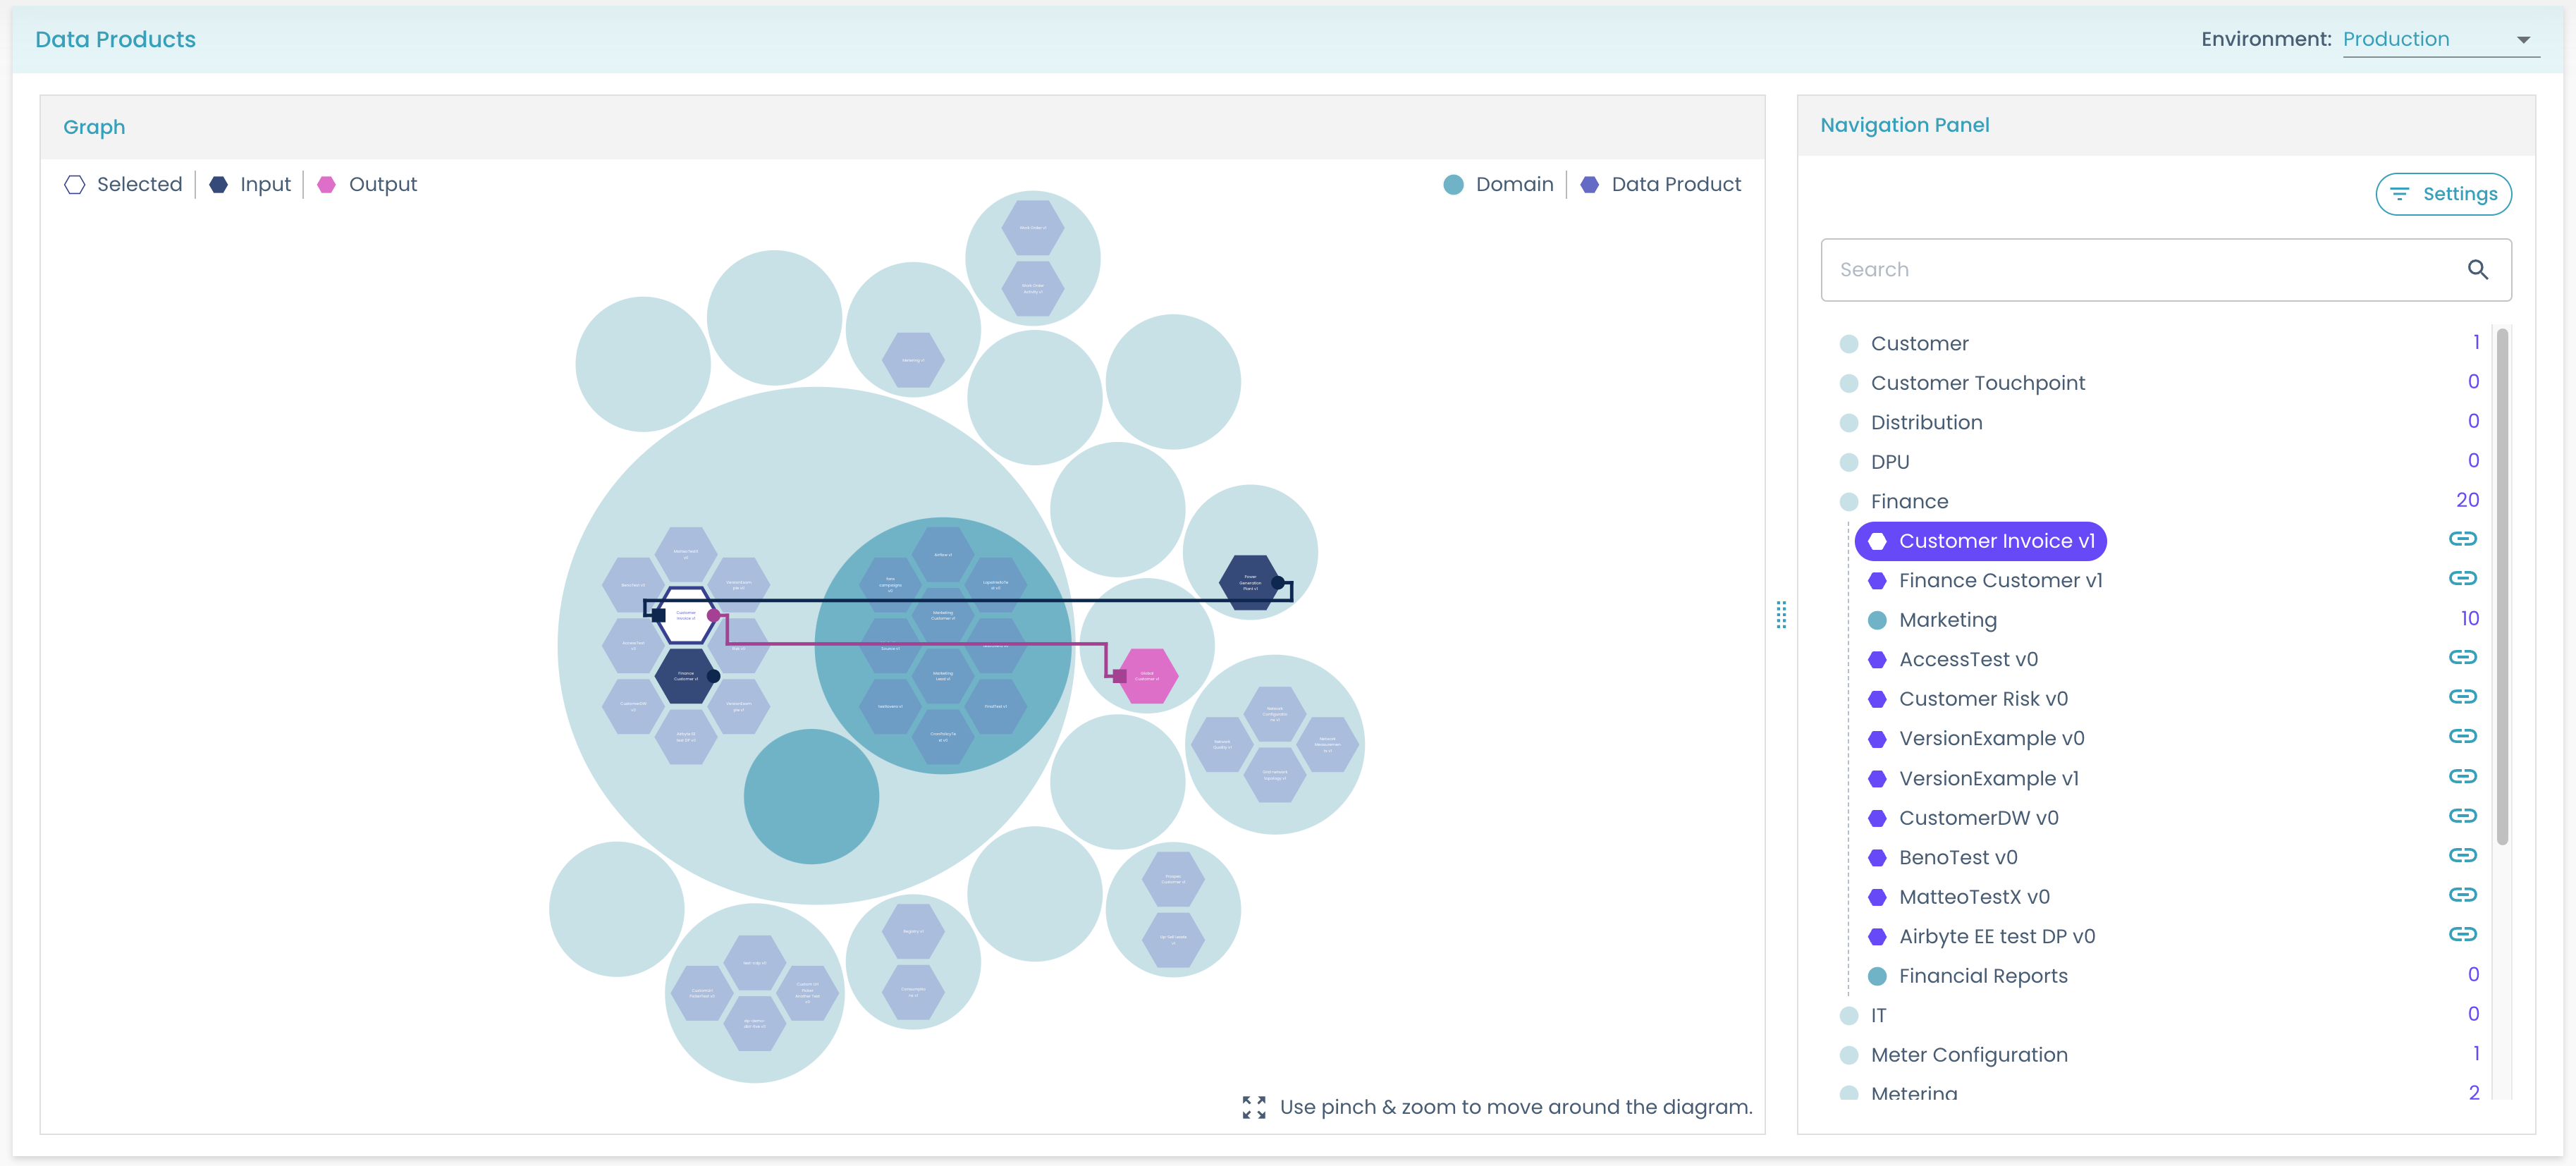
In the example image, Customer Invoice shows that it consumes an output port from Power Generation Plant and one from Finance Customer, while it is consumed by Global Customer. This underlines a possible circular dependency between the two that should be investigated further.
Meanwhile, the navigation panel on the right side, helps us to now lose track of where we are when navigating the graph visualization.
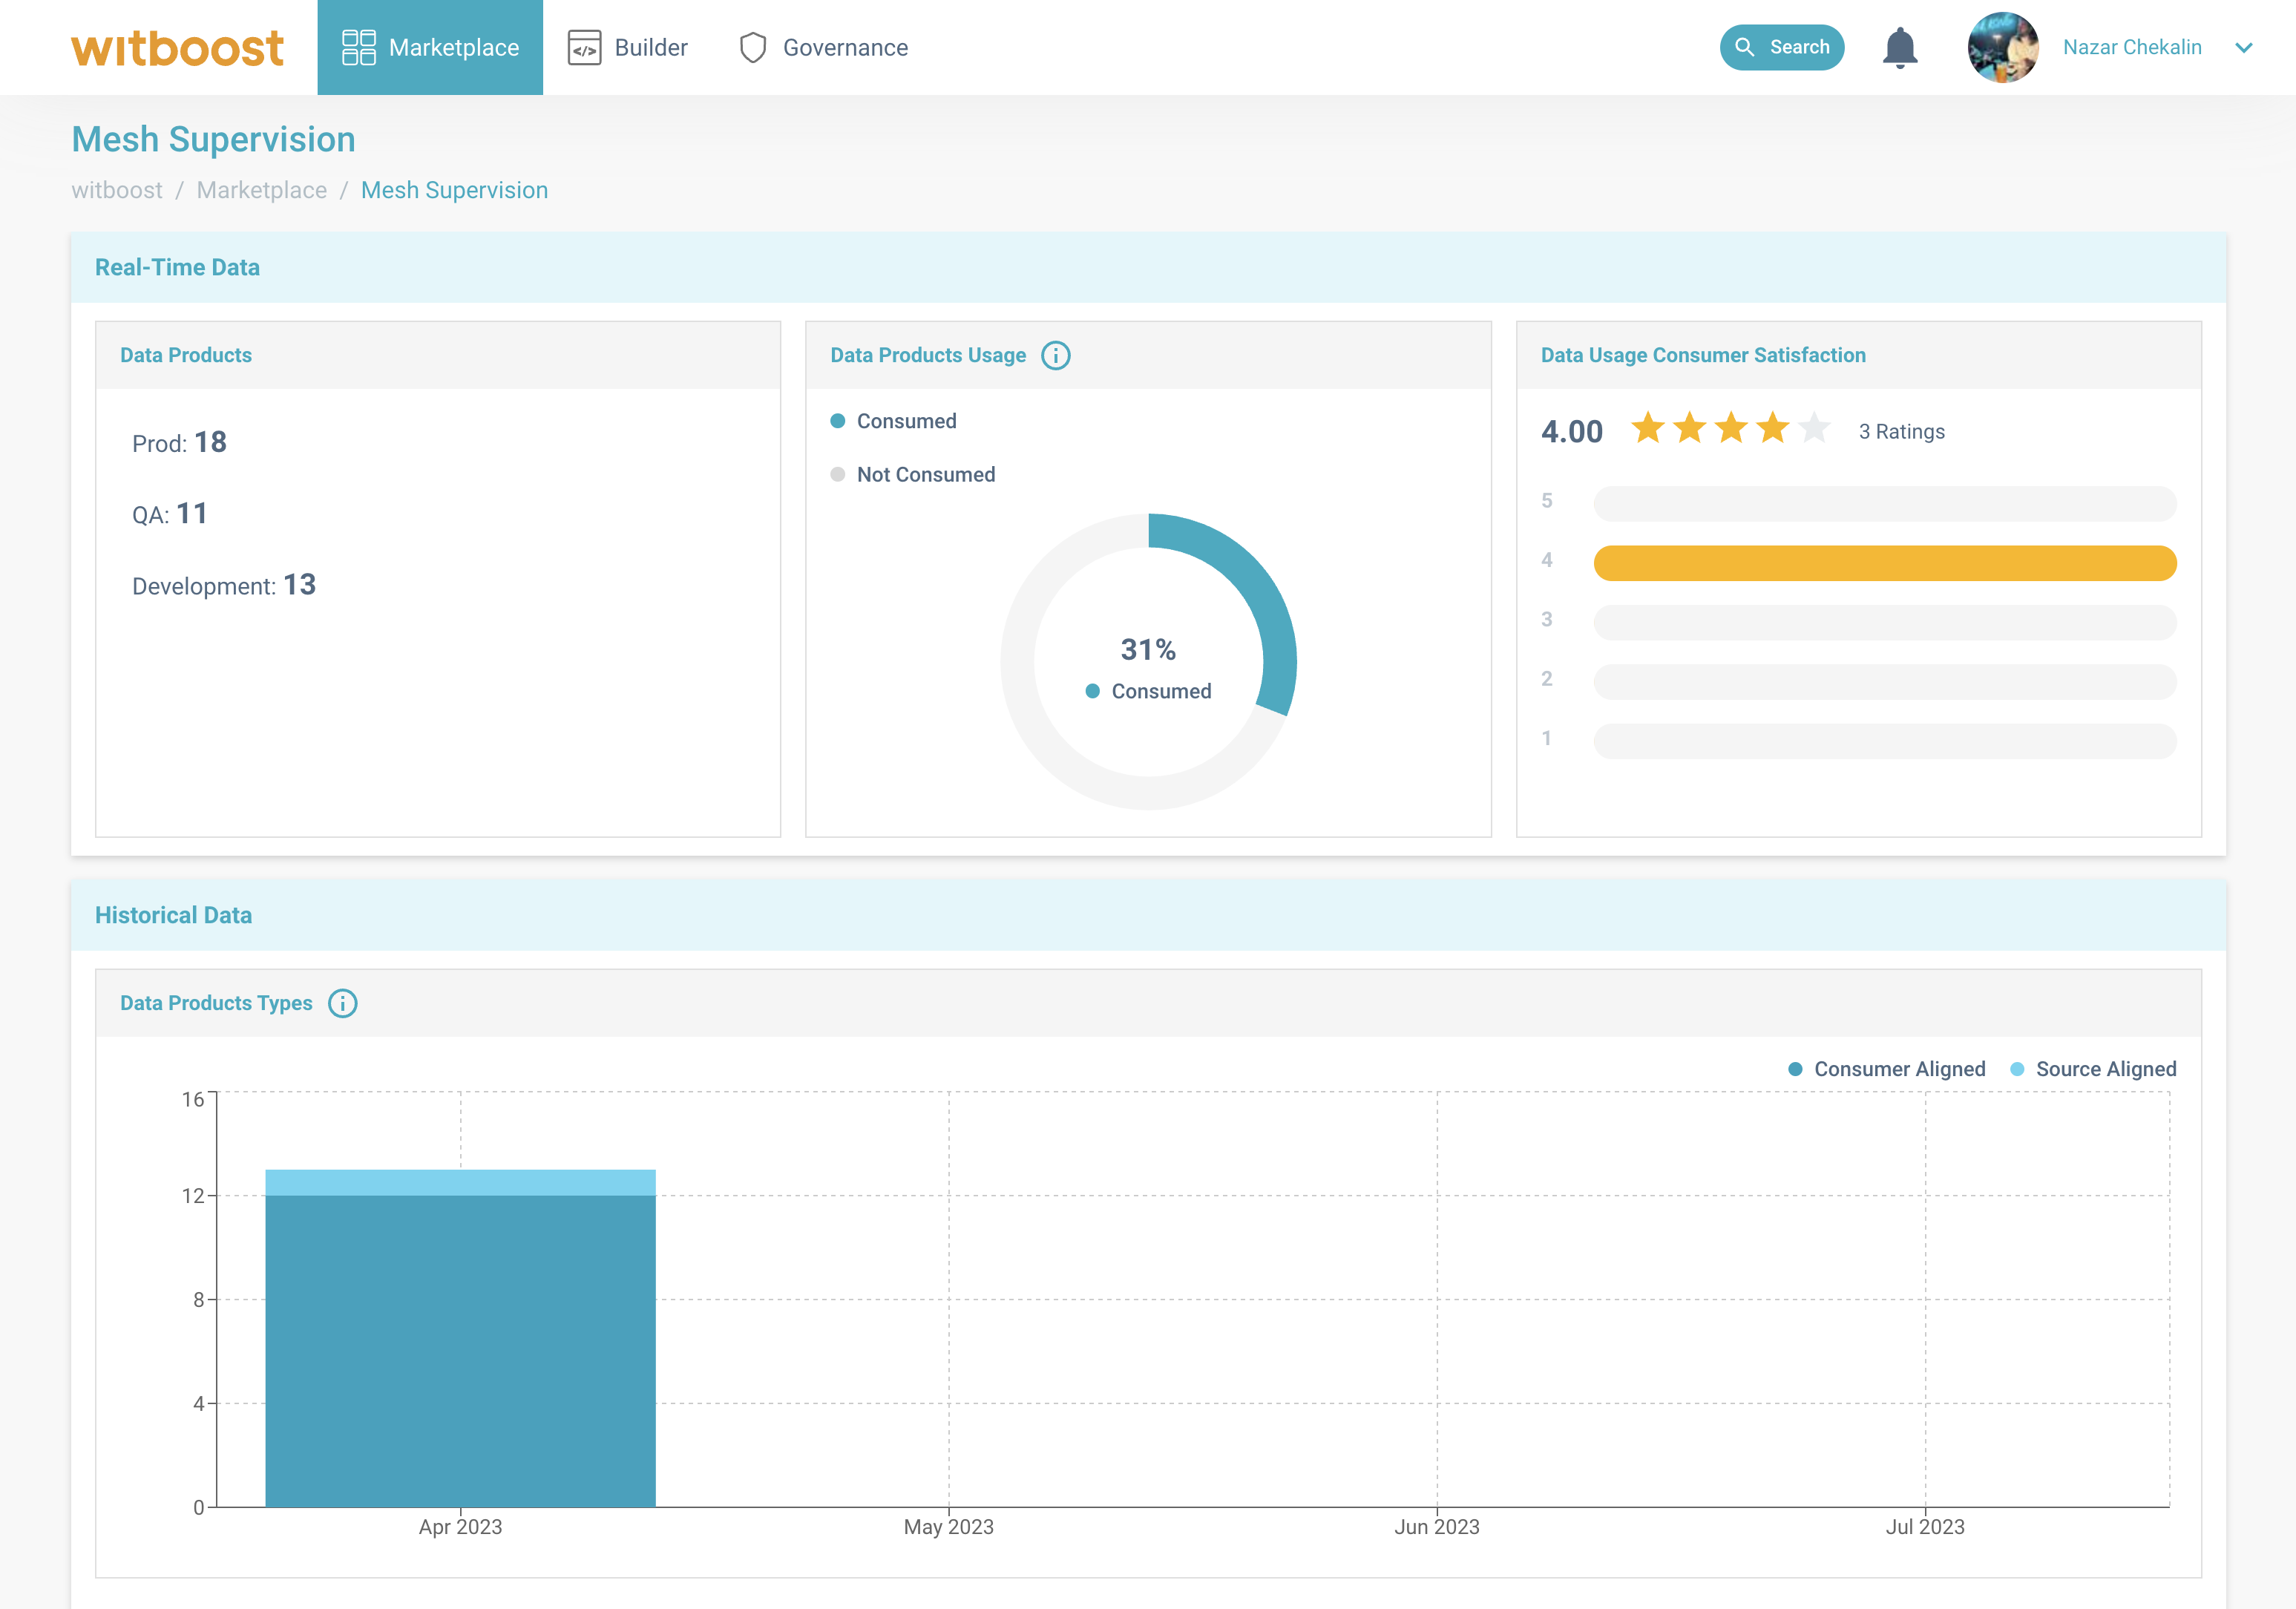
Mesh Supervision
Mesh Supervision is another tool to inspect how Data Mesh is going inside our organization.
It provides a dashboard for the board of directors to make informed decisions through the visualization of KPIs. As well as to inform the Platform Team about the quality that Data Teams are bringing into the Data Mesh. Mesh Supervision can be found in Marketplace > Mesh Supervision.