Evaluation and Testing
Evaluating a resource and testing a governance entity in this context relate to the same process but in different moments of the governance entity lifecycle.
The evaluation of a resource or a test of a governance entity always produces an Evaluation Report, that contains a list of Evaluation Results.
Each Evaluation Result expresses the outcome of a resource evaluated by a governance entity.
This way, you can have an Evaluation Report of a single governance entity against its resources perimeter, or an Evaluation Report for a single resource evaluated against all its applicable governance entities. The places were you can generate these two kinds of reports are different. The first, using the test workbench tool provided in the Governance tab, while the other one is what you usually see in the Control Panel of a specific resource when launching a test.
Testing using Governance Entities
Test workbench tool - Testing a Governance Entity against its resources perimeter
Testing a governance entity is an important part of the entity lifecycle, as you can assess whether the policy rules or metrics are correctly defined, and whether the policy produces the expected results when applied to the already published resources in the marketplace. Additionally, testing a governance entity allows you to verify that the policy is correctly applied to the expected perimeter of resources if any filter has been defined. Finally, testing a governance entity can help the governance team to see if the produced errors are understandable by data teams to quickly identify and fix any issues with their resources and ensure that they comply with the governance entity requirements.
While creating a policy or a metric, you usually do some iterations to refine and upgrade the business logic. To do so, you can create a draft policy/metric, and check what kind of effect it will have on existing deployed resources, before enabling it and making it effective for users.
Remember that only Draft policies and metrics are editable, and once moved to a different status (Grace or Enabled) they will not be editable anymore. For this reason testing is usually done when working with Draft elements, so we can update them and solve any problem found. To understand more about the status lifecycle, go here.
To test a governance entity, simply go in the Registry page. After you have selected an environment from the dropdown
menu
in the top right corner, point to the governance entity that you want to test then click on the contextual menu,
then Test:
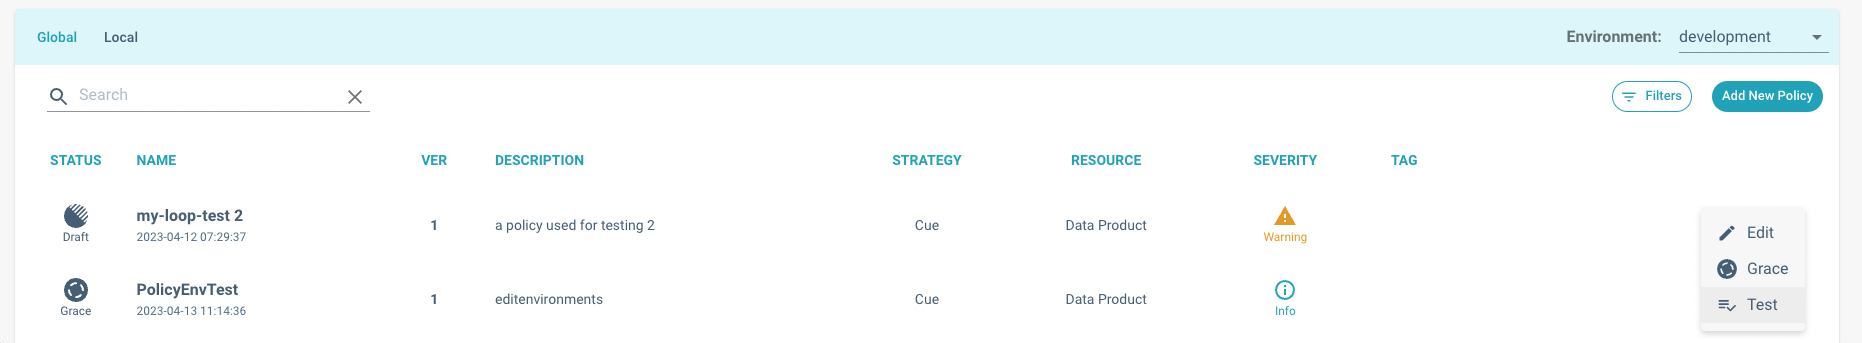
Policy Registry. The contextual menu is located at the far right of each table row.
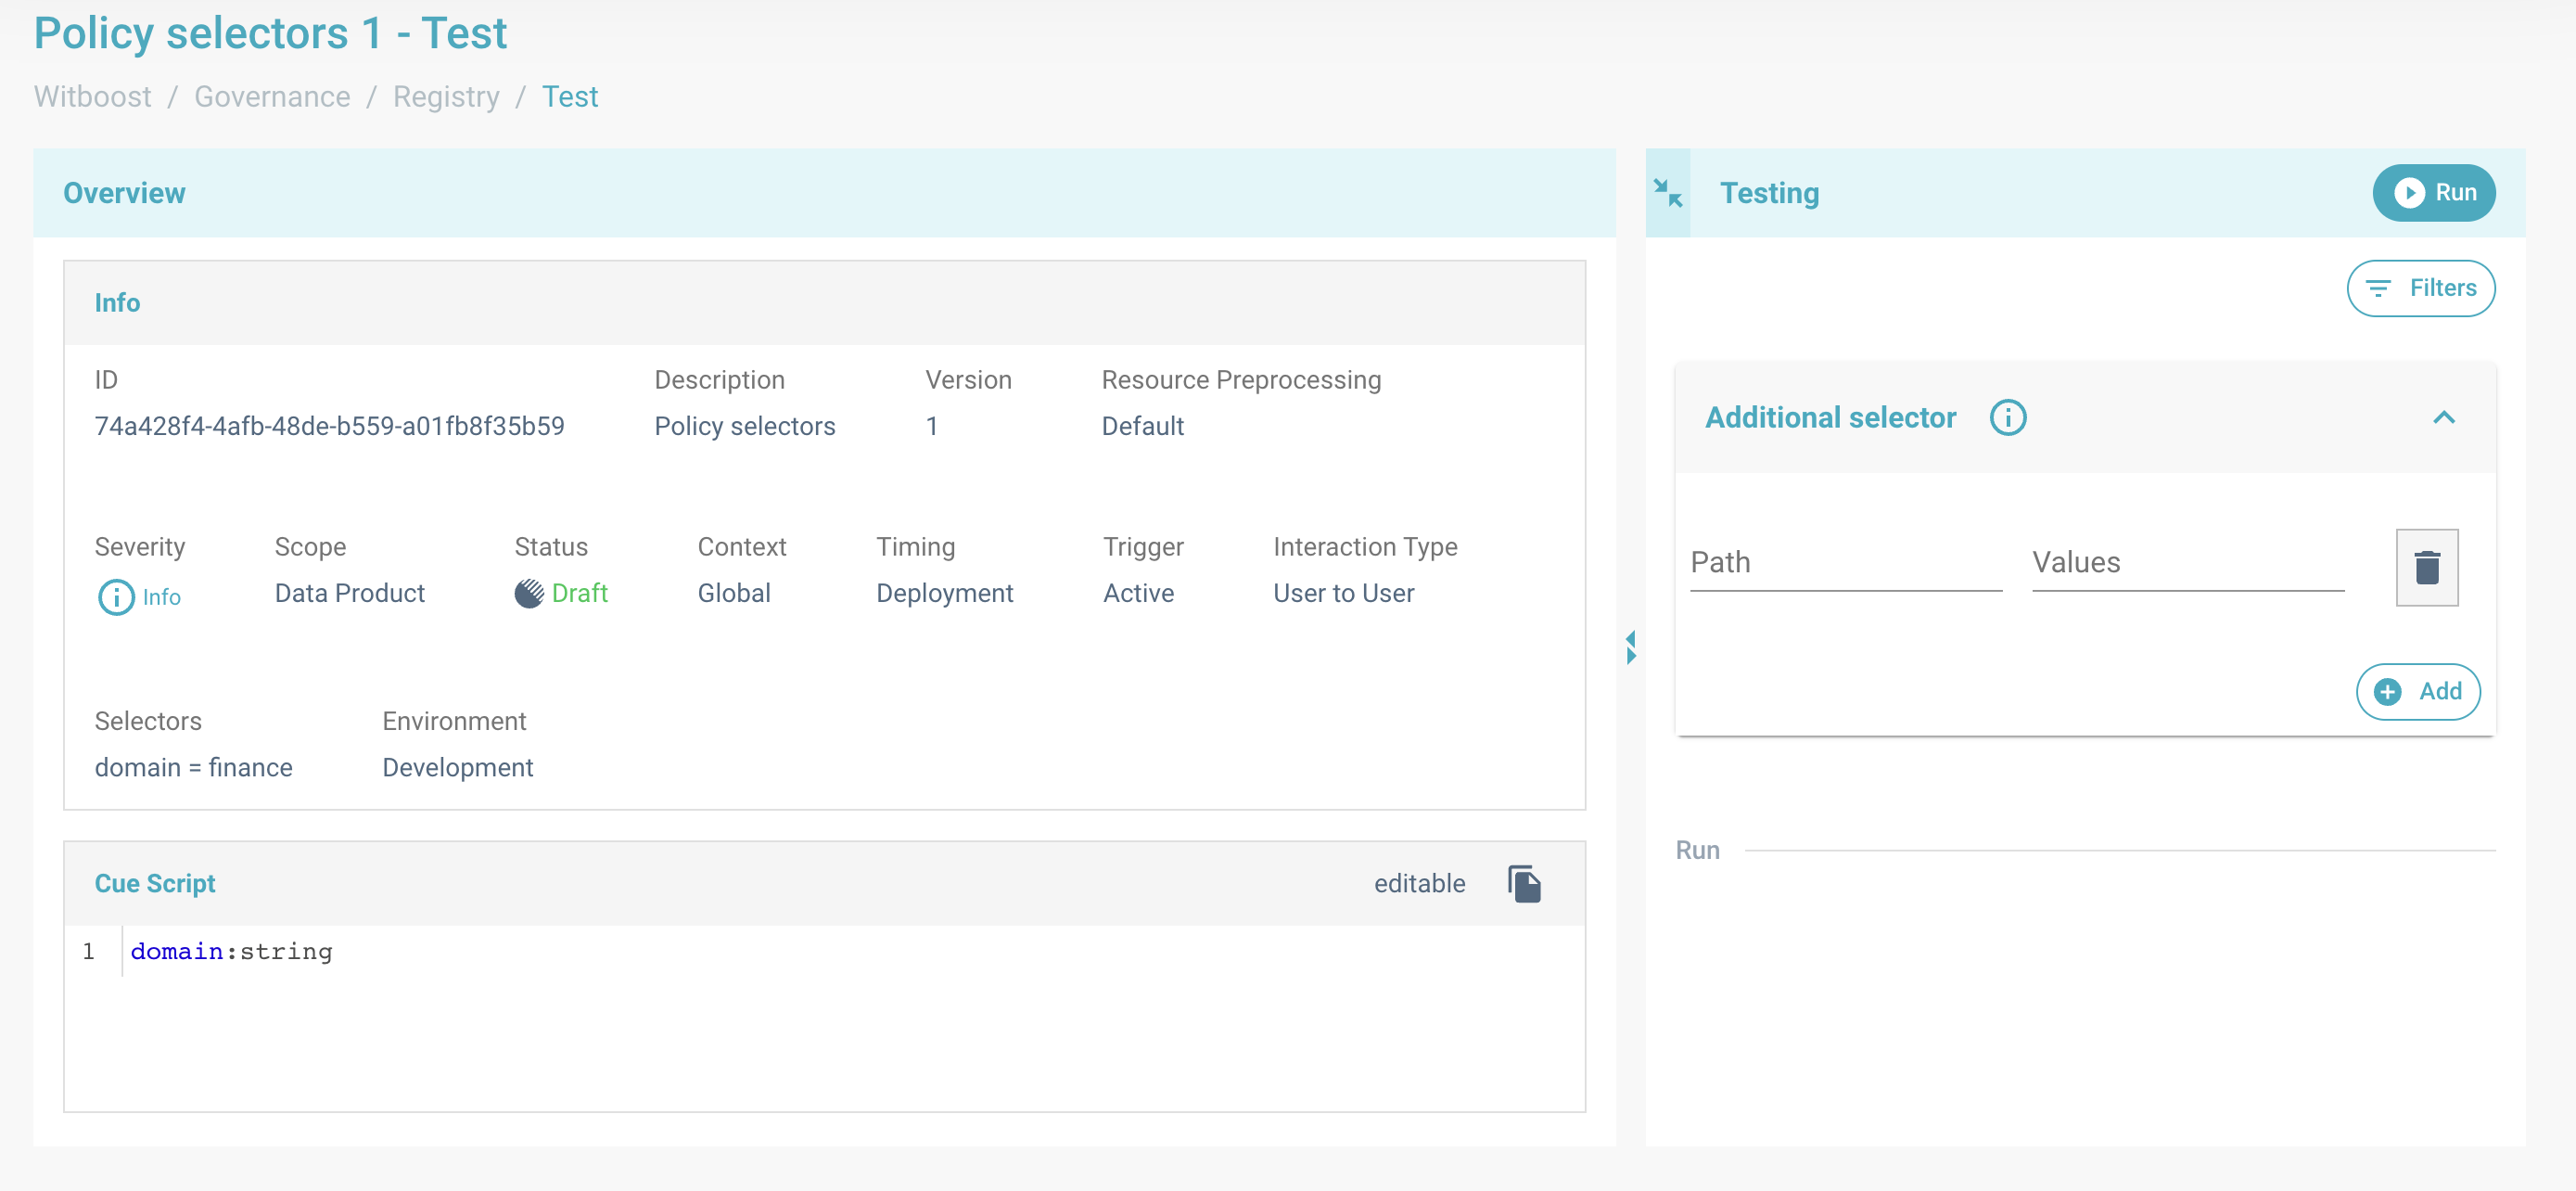
You will land in the main page for testing a governance entity:
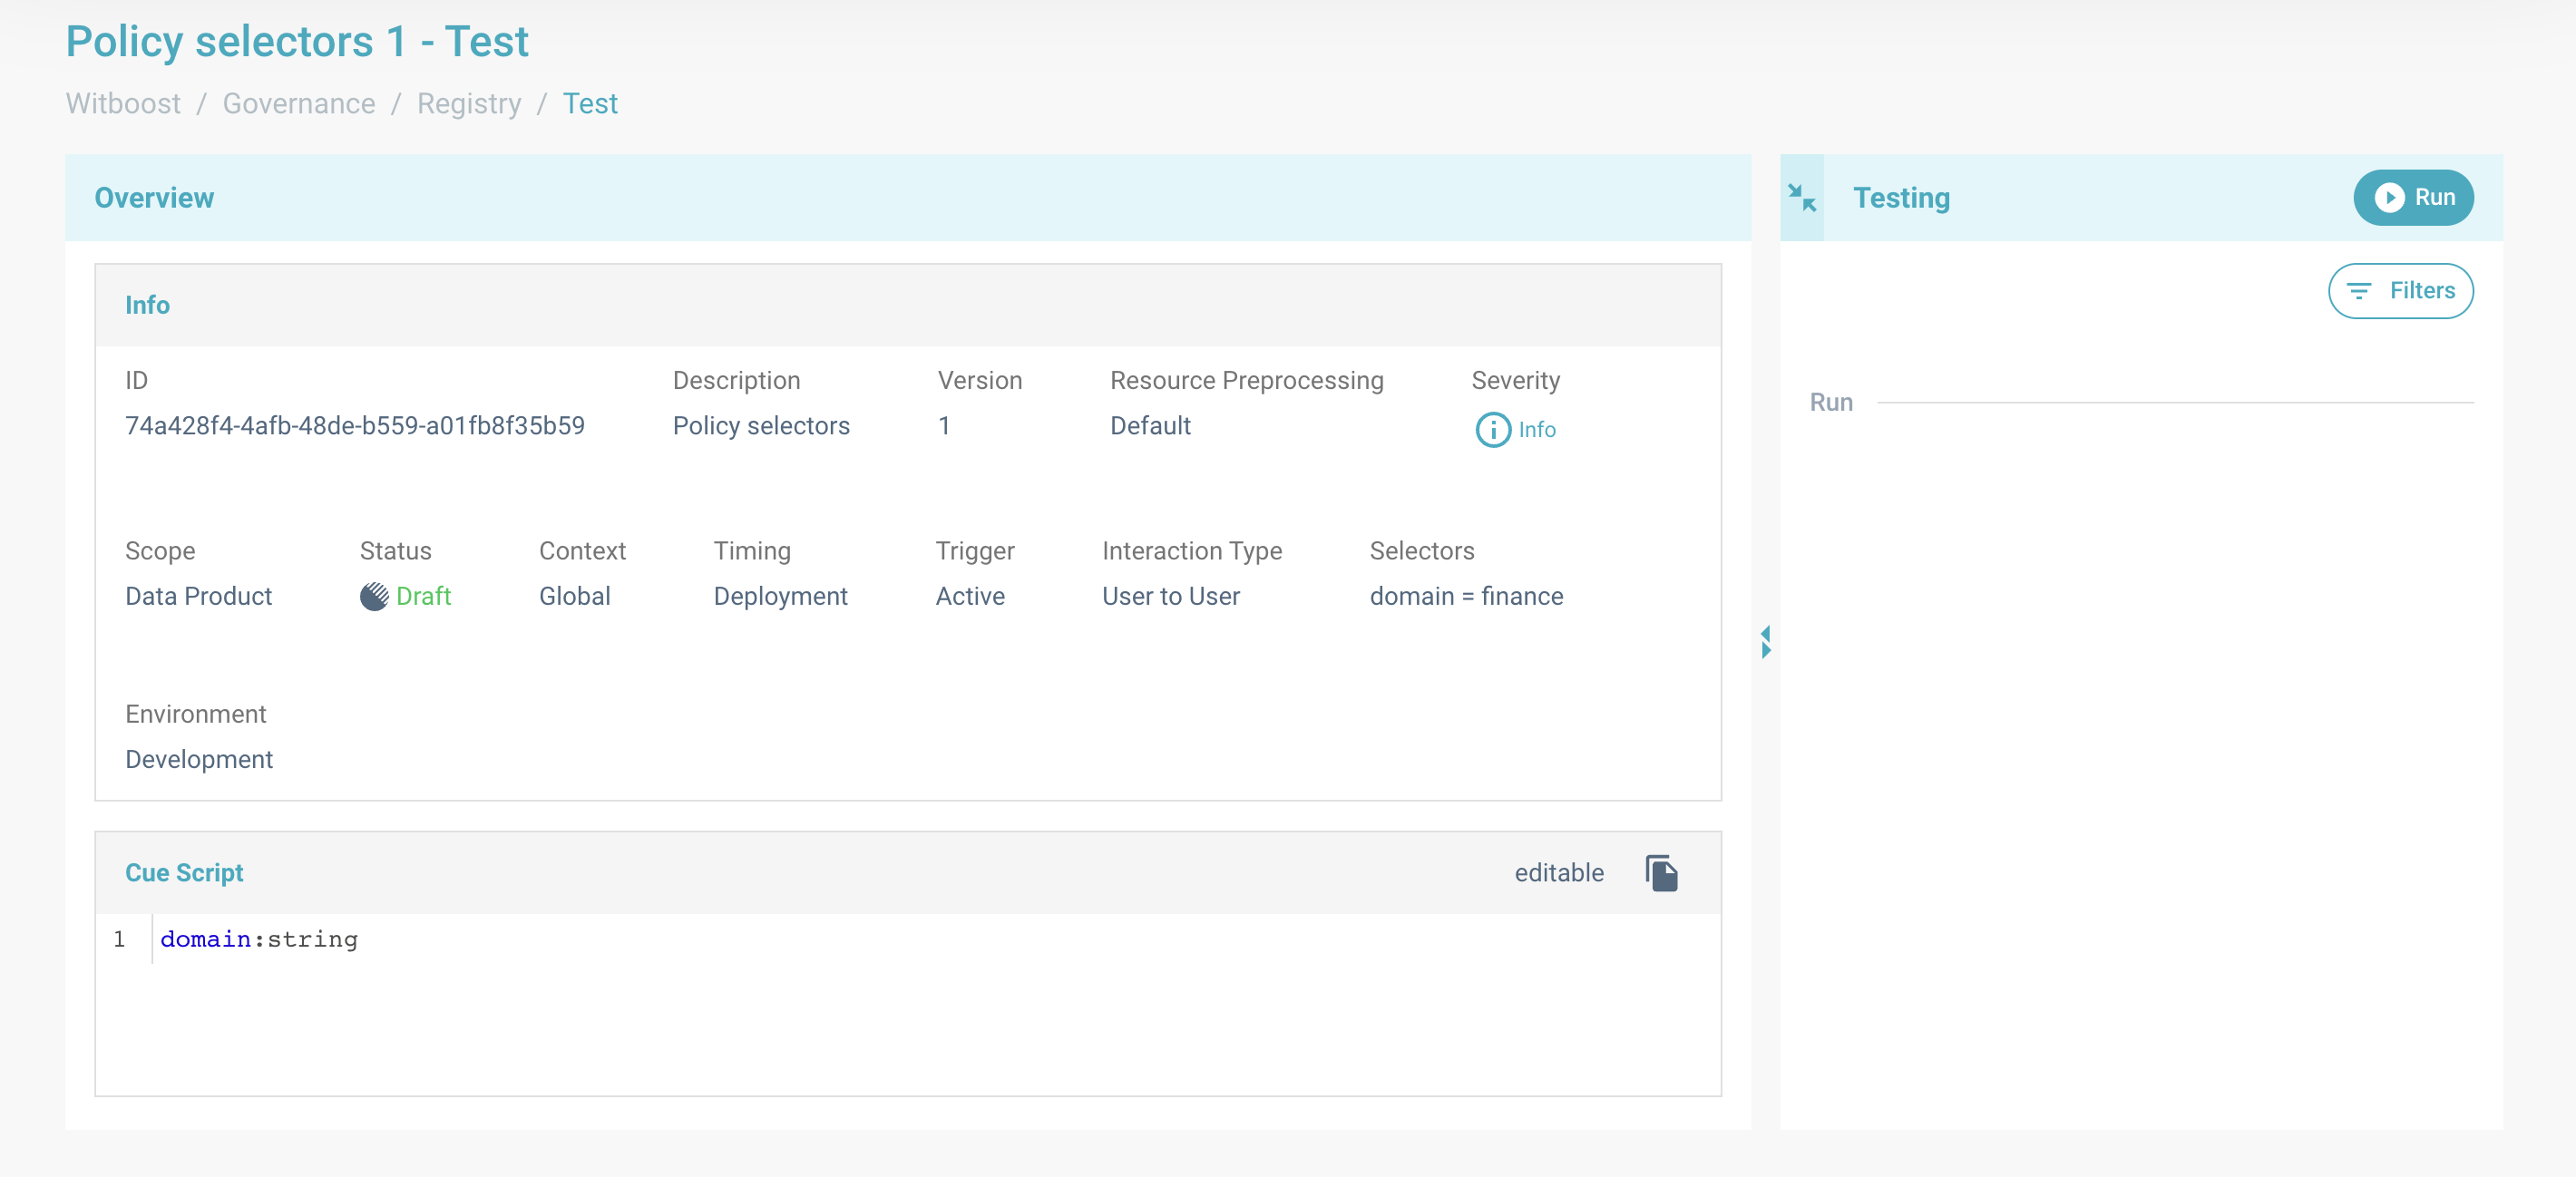
Test benchmark tool
Here you can also take a look at the details of the governance entity.
When you click on Run, the test will start and the progress bar will inform you on the total number of evaluations
executed.
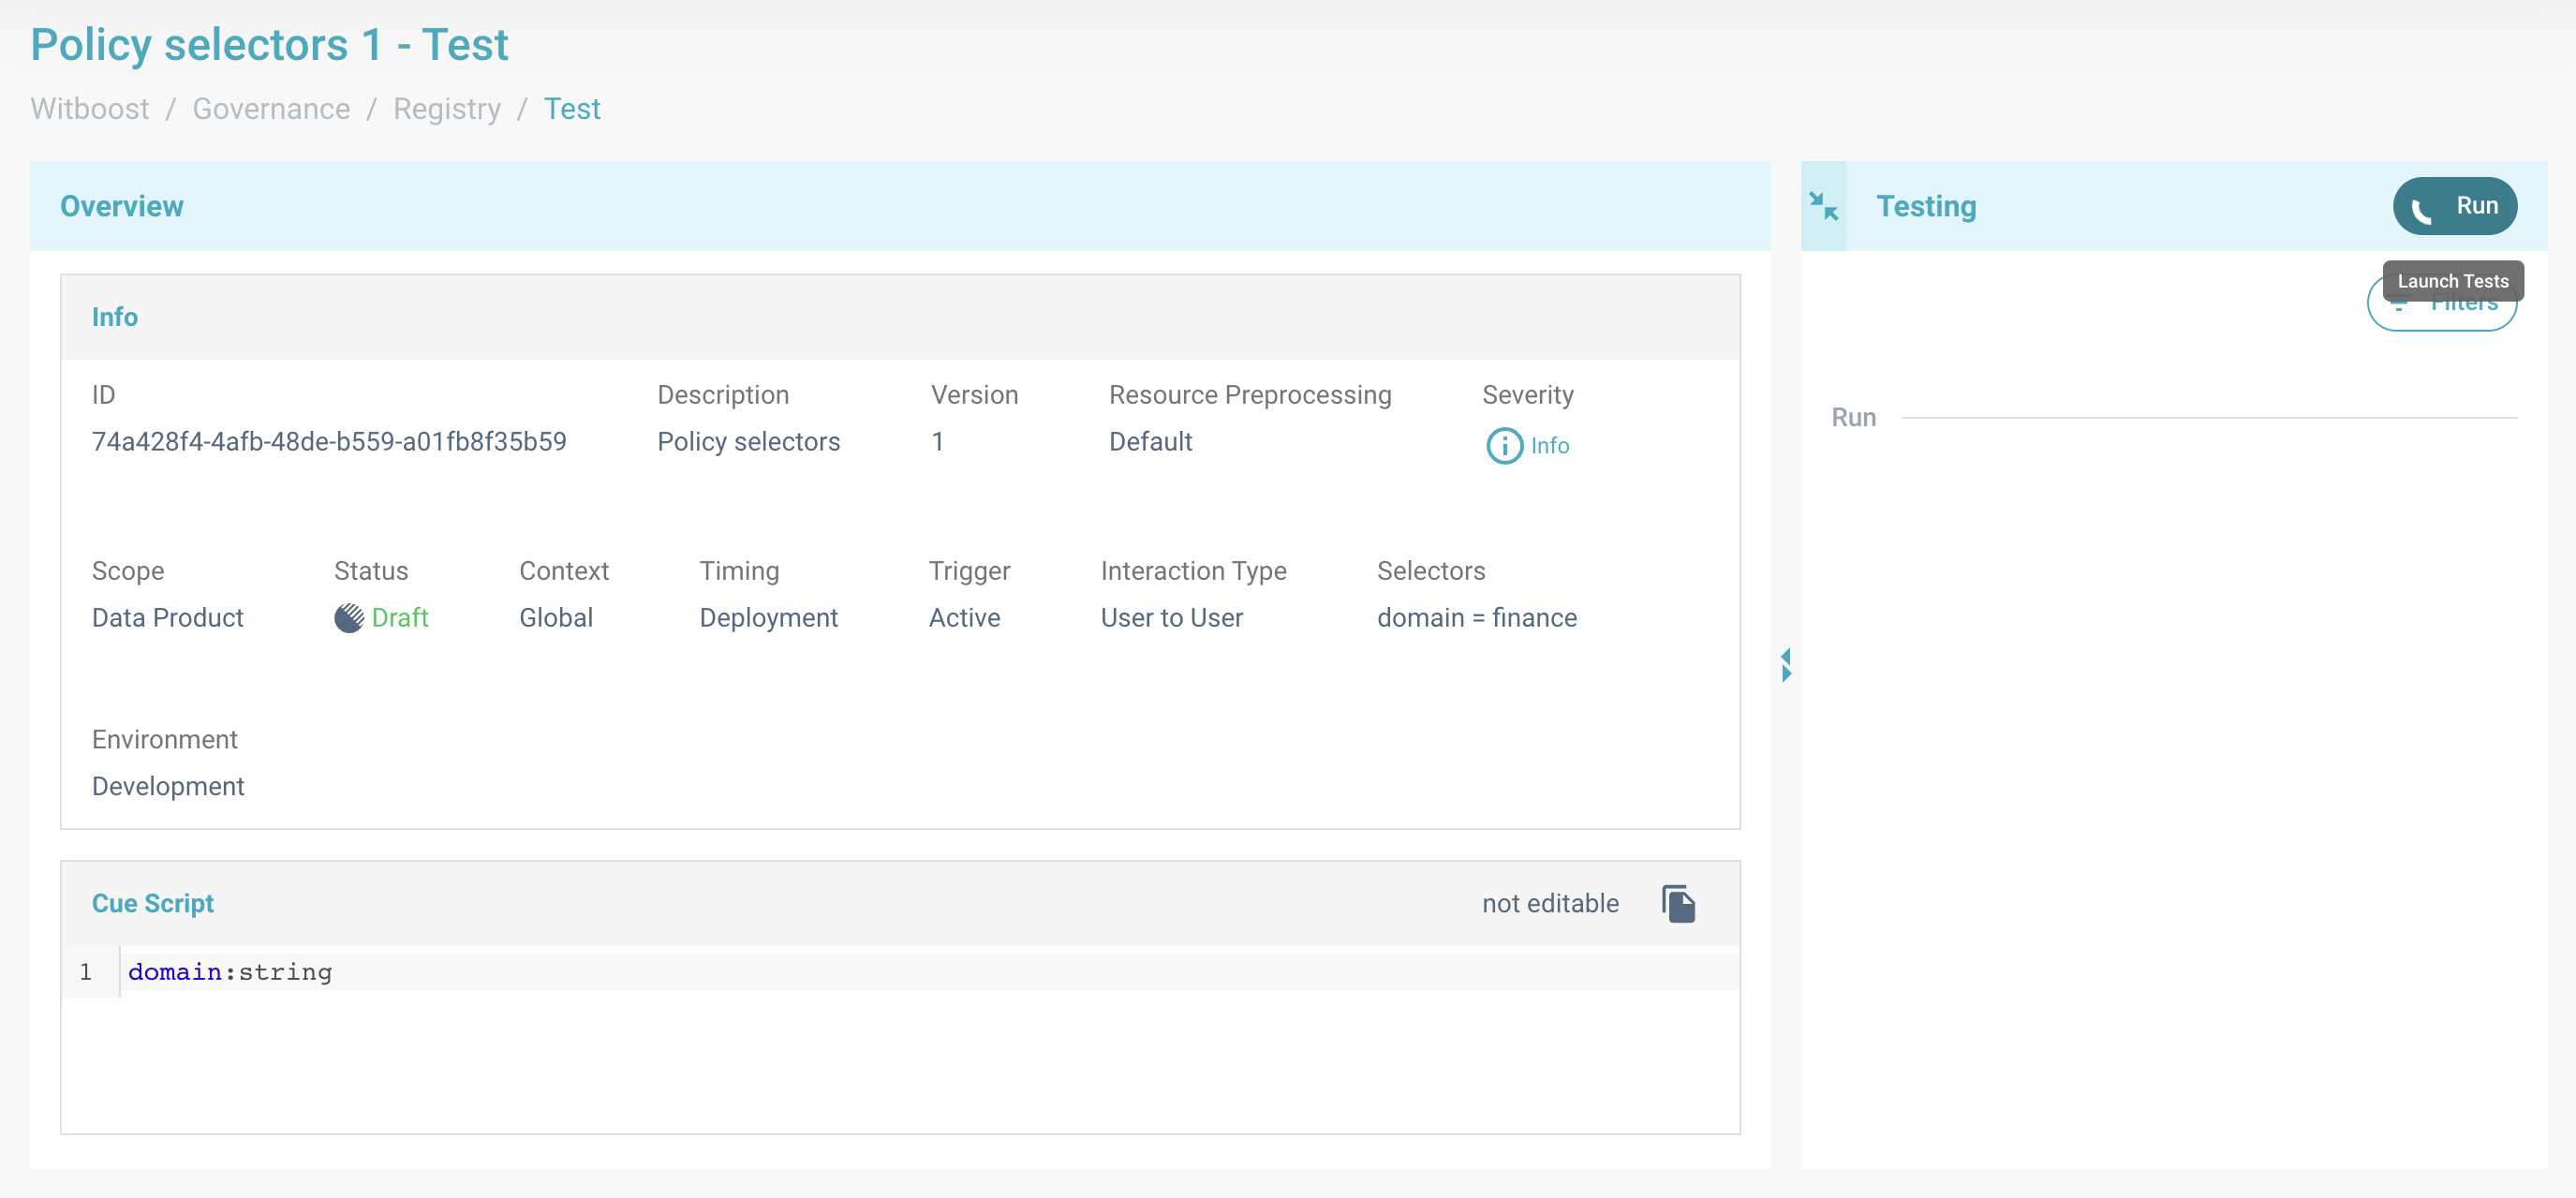
Test in progress, the governance entity perimeter is being evaluated and the entity is being executed for all of the applied resources.
At the end of the tests, you will see the list of resources that fell in the perimeter of the governance entity. They will be divided between compliant and not compliant. For all the non-compliant ones, you can actually see why the policy failed by clicking on the resource. A right sidebar with info test, errors list will appear.
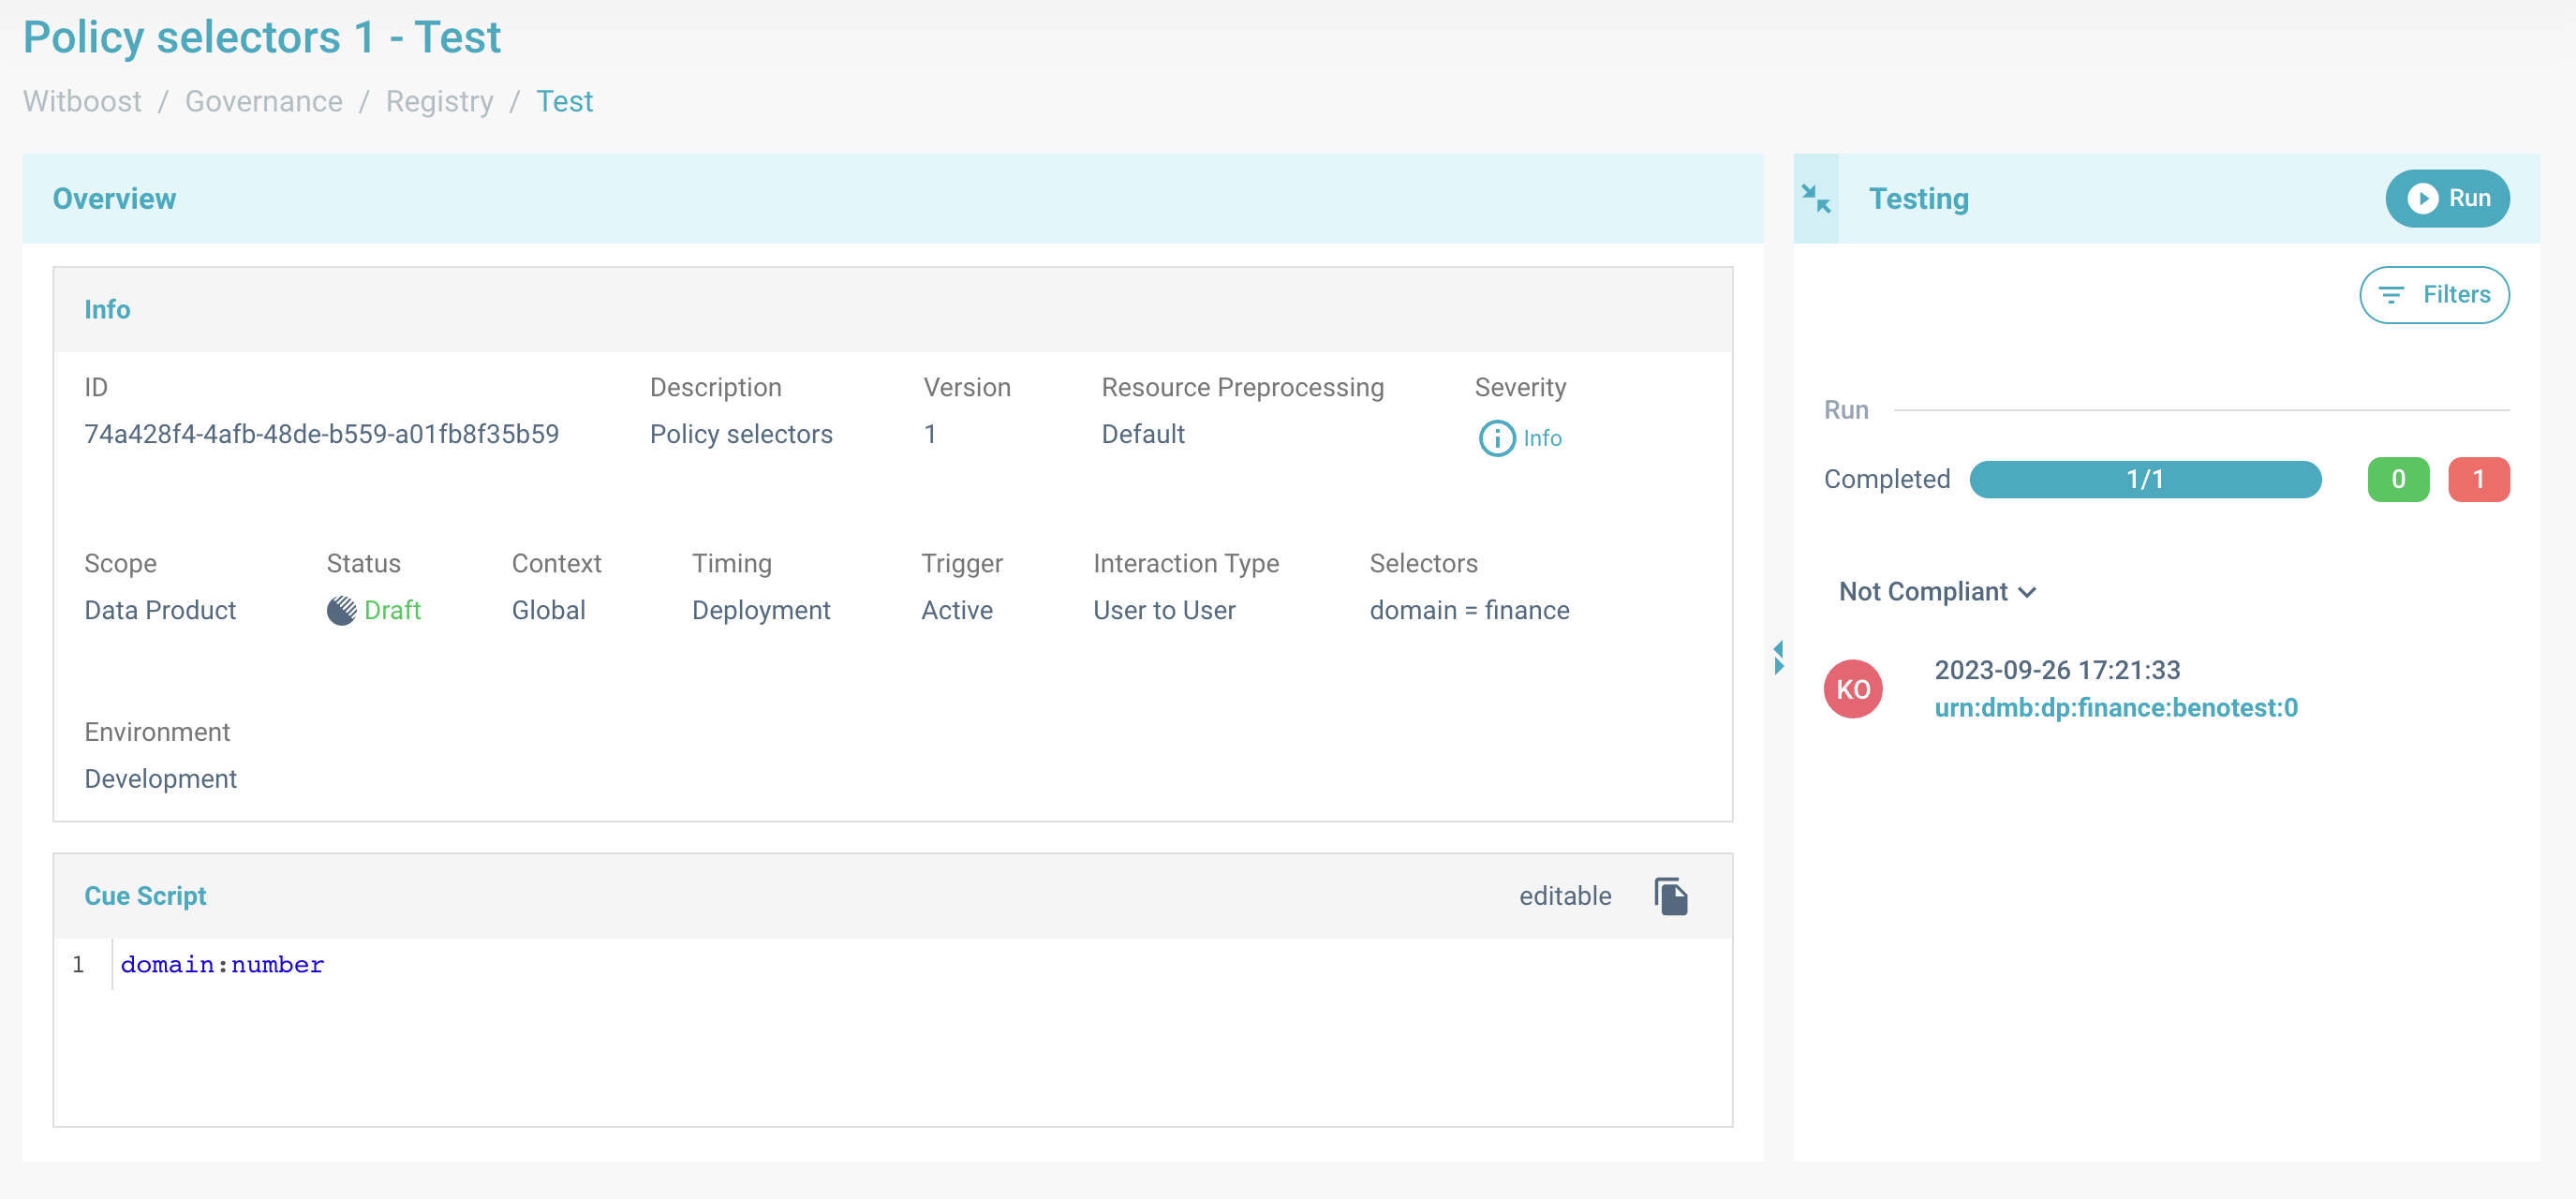
Error message for one resource. Test is finished and a there is a not compliant result.
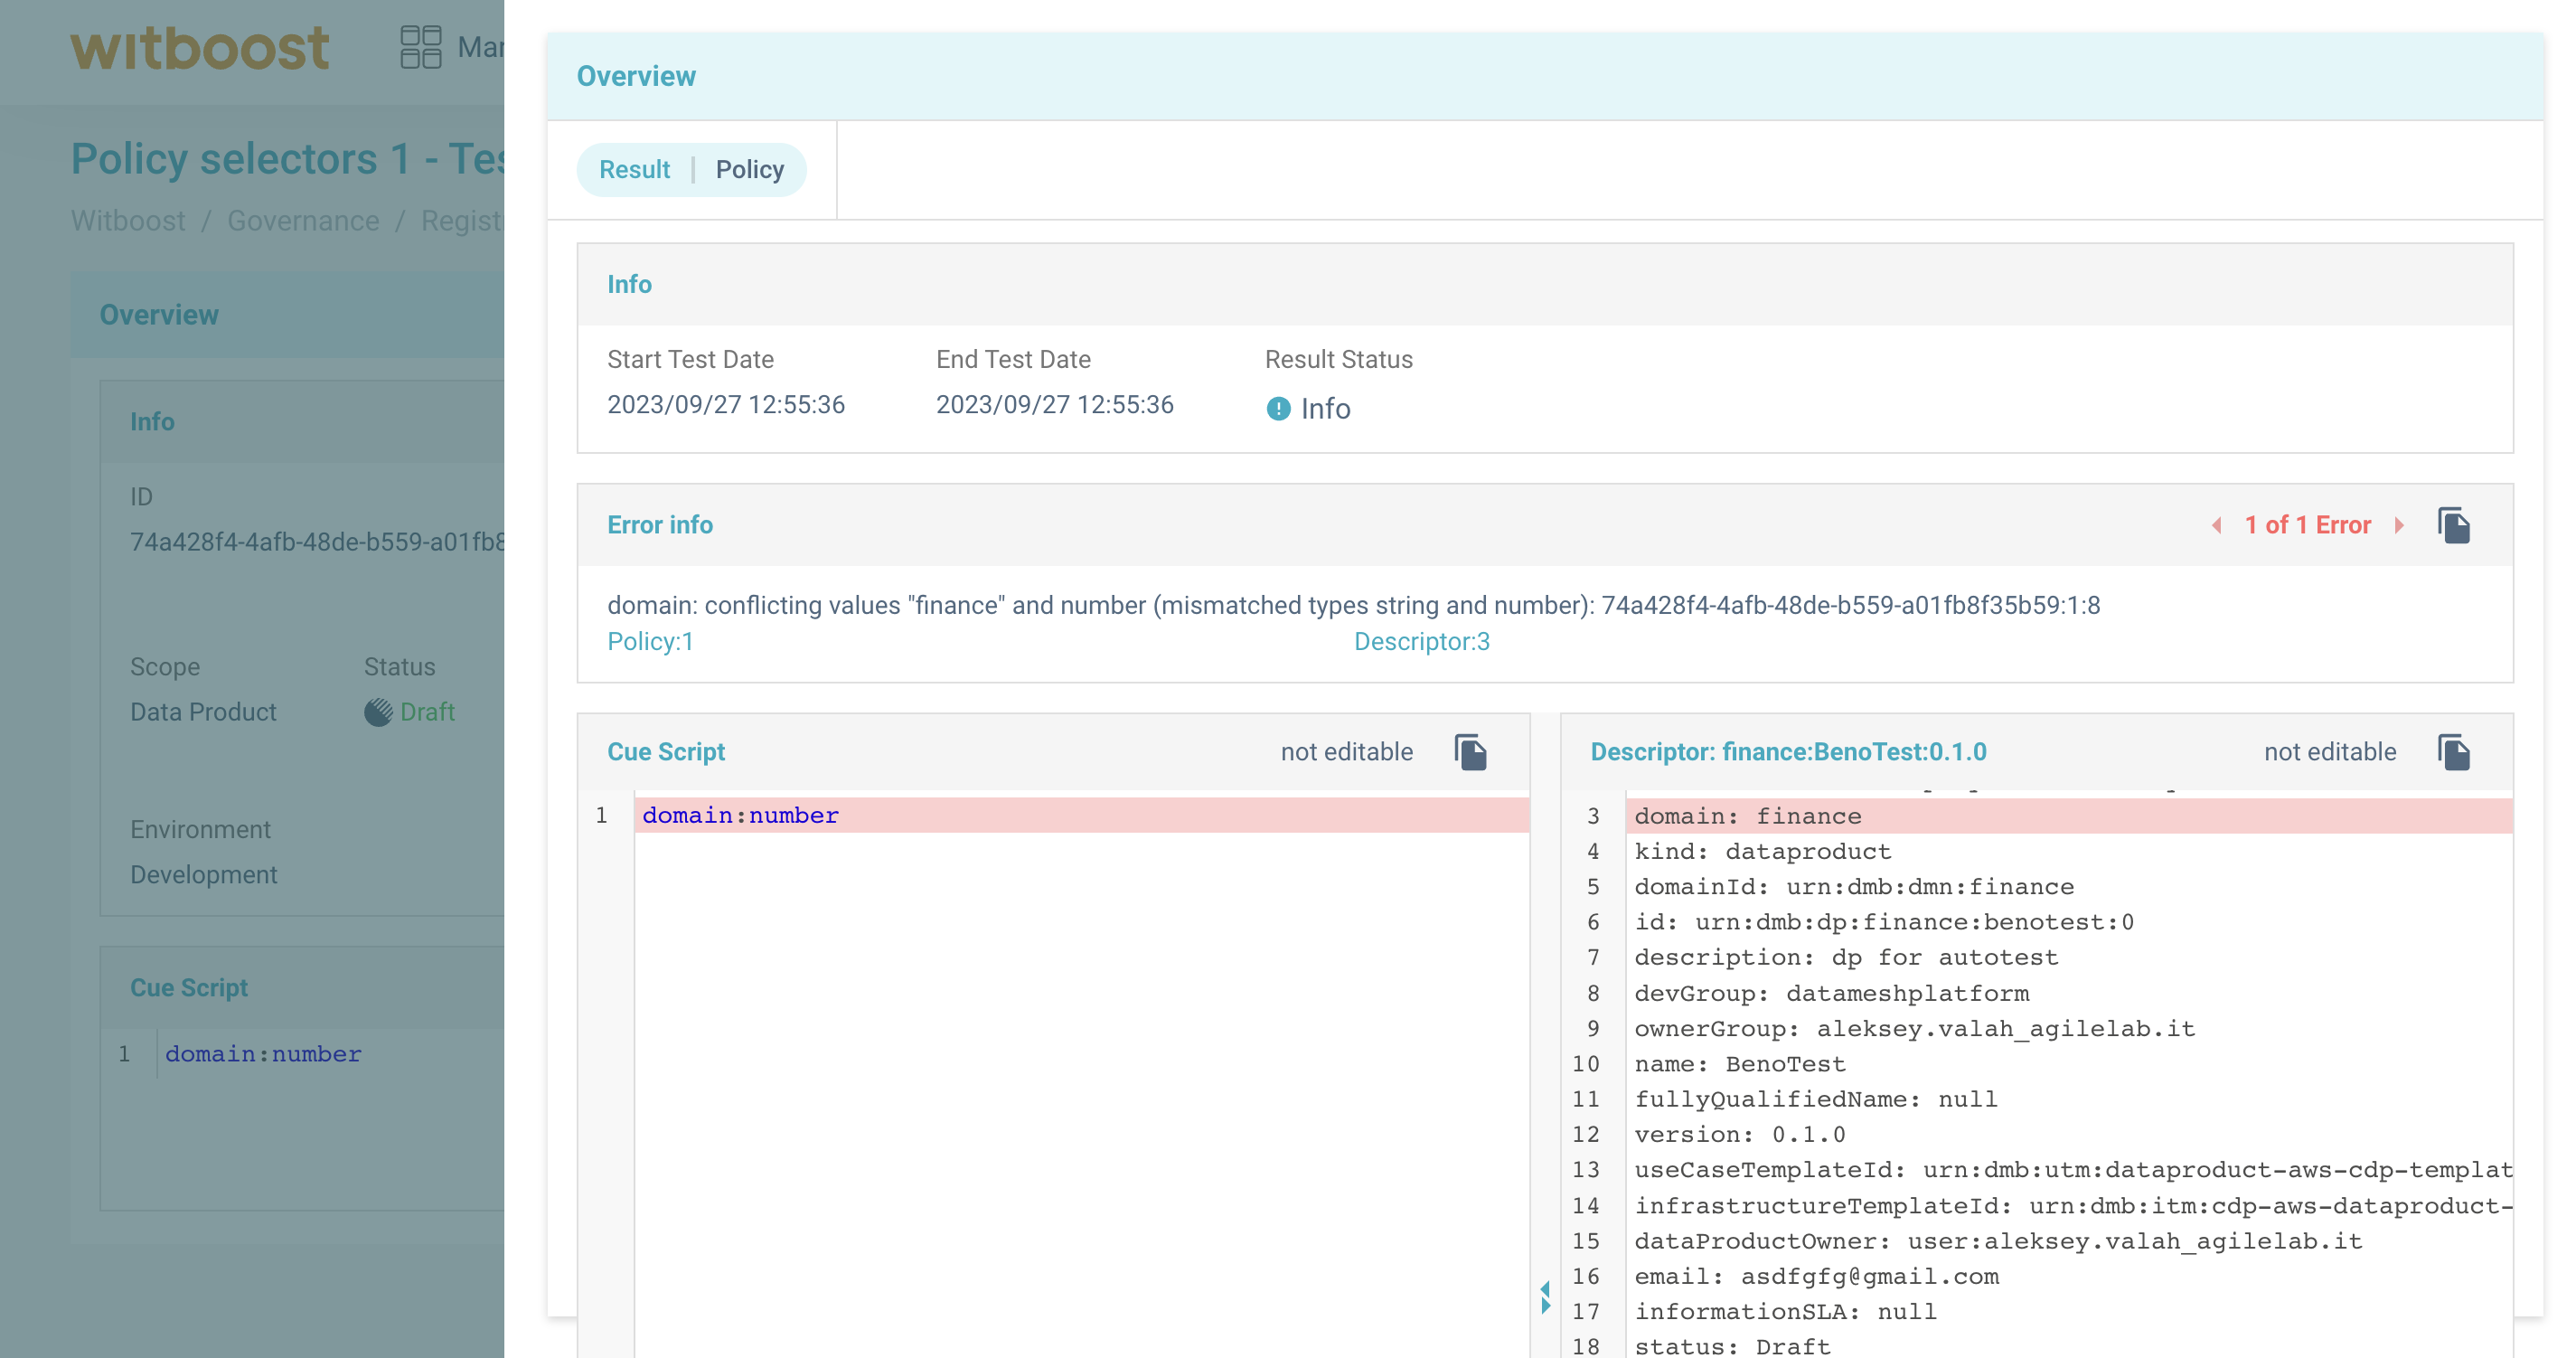
Error detail panel. In this example, the governance entity failed because the field domain with
value
finance was not a number.
Testing a policy (or a metric) simply means to load all the deployed resources that belong to its perimeter, and run the governance entity against all of them. The results will be displayed just as "compliant" or "not compliant", since the severity will be the same for all of them. You can test all kinds of policies and metrics with an "active" trigger. This means that we can test also runtime policies, which will be executed right away for the test, even if they will be scheduled when enabled. For example, metrics and policies with "remote" engine will invoke the microservice to get the result, CUE policies will perform the CUE script evaluation, and so on. In the end they will just return a set of results, that will be displayed to the user.
A test execution result contains the same exact information as a regular evaluation result, and is identified by the triple: policy/metric, resource, and timestamp. The details regarding the resource (represented as its descriptor) and the timestamp will be contained in the result panel, which contains also another tab containing all the fields of the relative policy/metric.
Restricting the resources perimeter by using additional filters
From Filters button it's possible to restrict the resources perimeter. Click on this, a panel where insert filters is appearing
Therefore it's possible to add more stringent filters on the results that would be obtained by testing the resource.
It's sufficient to indicate a path and a list of values for each.
Additional selectors form array. By Add button another key-values pair is adding.
If path matches some additional selector, added during entity creation, a warning message will be shown.
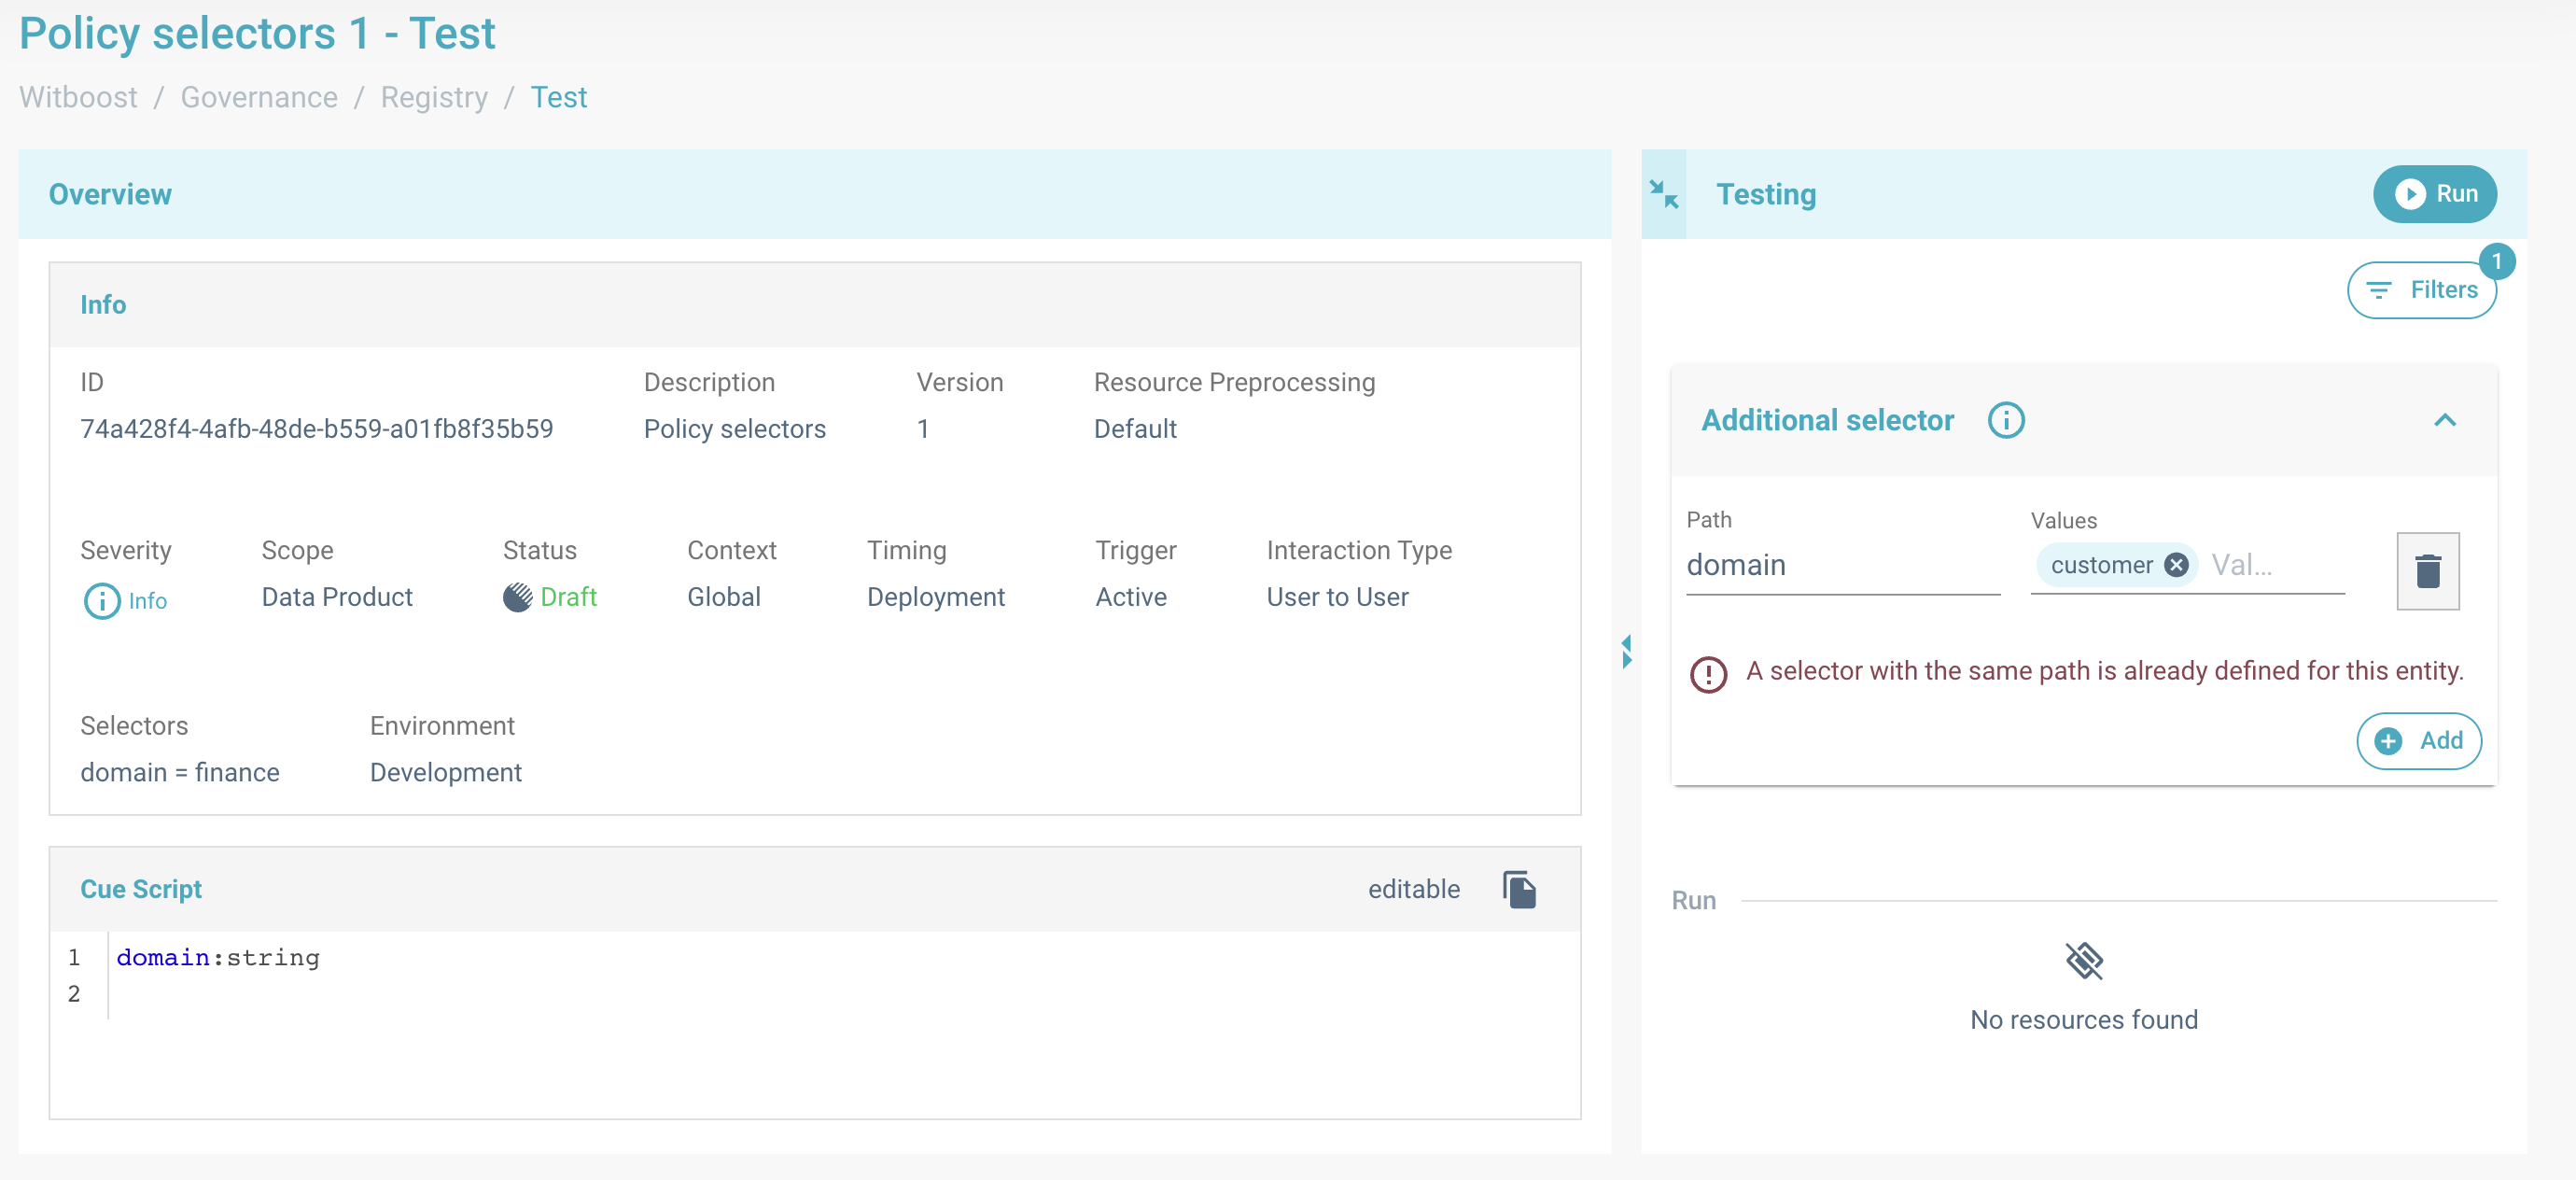
Warning message for an additional selector. In this example, the added path "domain" corresponds to the "domain" selector in the overview panel,
then the test results will be filtered again against the newly added domain ('customer').
No resources with a finance domain has a customer domain, so list of resources will be empty.
Control Panel - Testing a resource against all applicable Governance entities
In the lifecycle of a resource, for example in Data Mesh we have the lifecycle of a Data Product, testing the created resource is an essential part of the process as it allows to check for compliance within the platform restrictions, ensuring that any deployed resource has the level of quality defined by the governance team.
To test a resource against the all the governance entities, you can go to the Control Panel of the resource, click on the environment you want to test and then the Control Panel will appear.
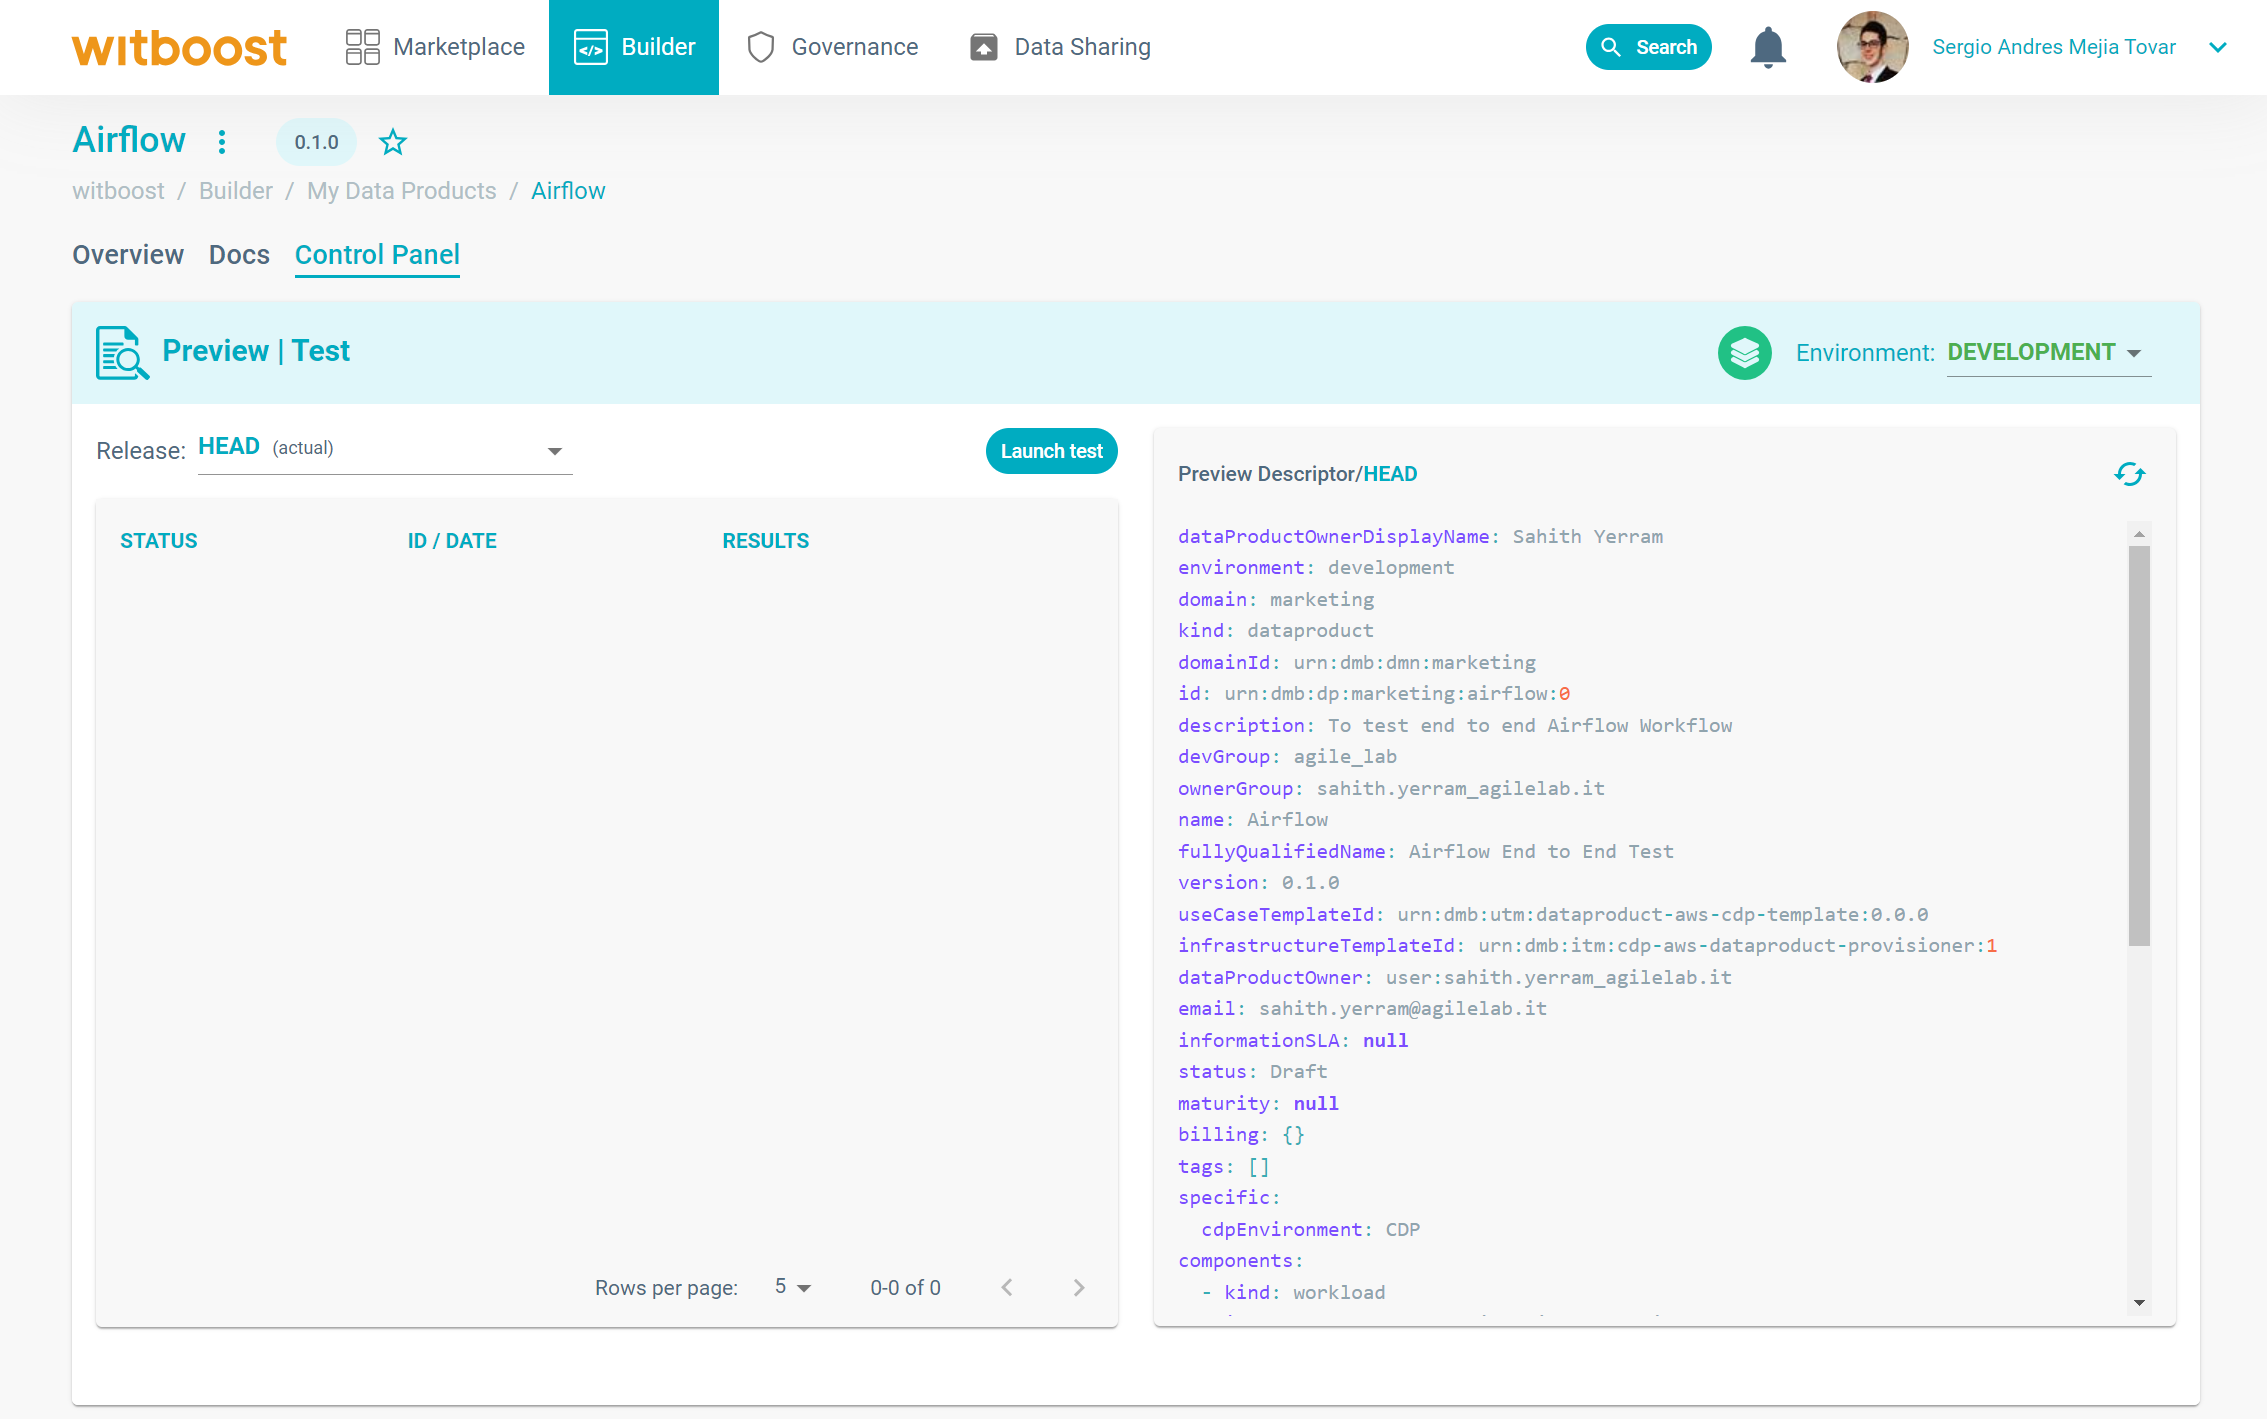
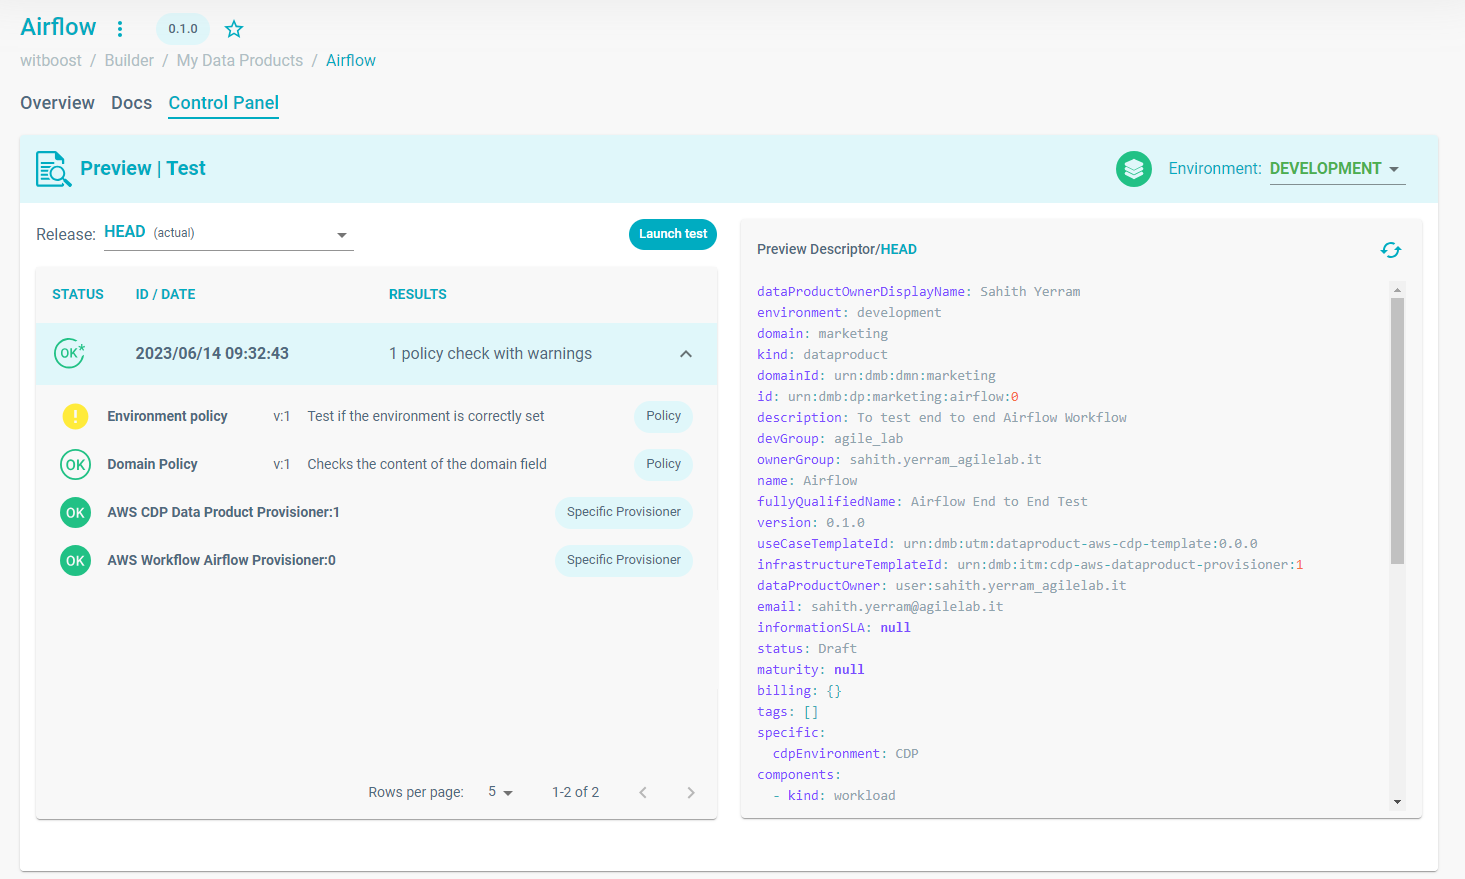
The Control Panel of a resource. In this case a Data Product on a Data Mesh platform.
By clicking on the "Launch test" button, the governance platform will execute all the governance entities that are applicable to the current resource based on the properties of the policy or metric, specially their status, context, timing, trigger, and selectors attributes. The test will start and the resource will be evaluated against the governance entities. This might take a few seconds to finish based on the amount of existing governance entities and the checks done by them, but at the end, an Evaluation Report will be created and you will be able to see how many checks passed (OK) and how many failed (KO) and the severity associated to it.
If the Evaluation Report passed without problems, you will see green OK sign, and if any warnings where thrown, it will say so and the icon will have a star in it as well. If the report contains blocking errors, you will see this as a red KO sign.
Remember that if a governance entity with an Error severity fails, you won't be able to deploy the resource. Warning and Info governance entities won't block the deployment, but they will an error if they fail. Furthermore, the resource will be flagged for each failed Warning governance entity. For all the failed (KO) governance entities, an error message is available in order to understand what went wrong.
Outcome of the launched tests, where a report can have an OK status or KO status.
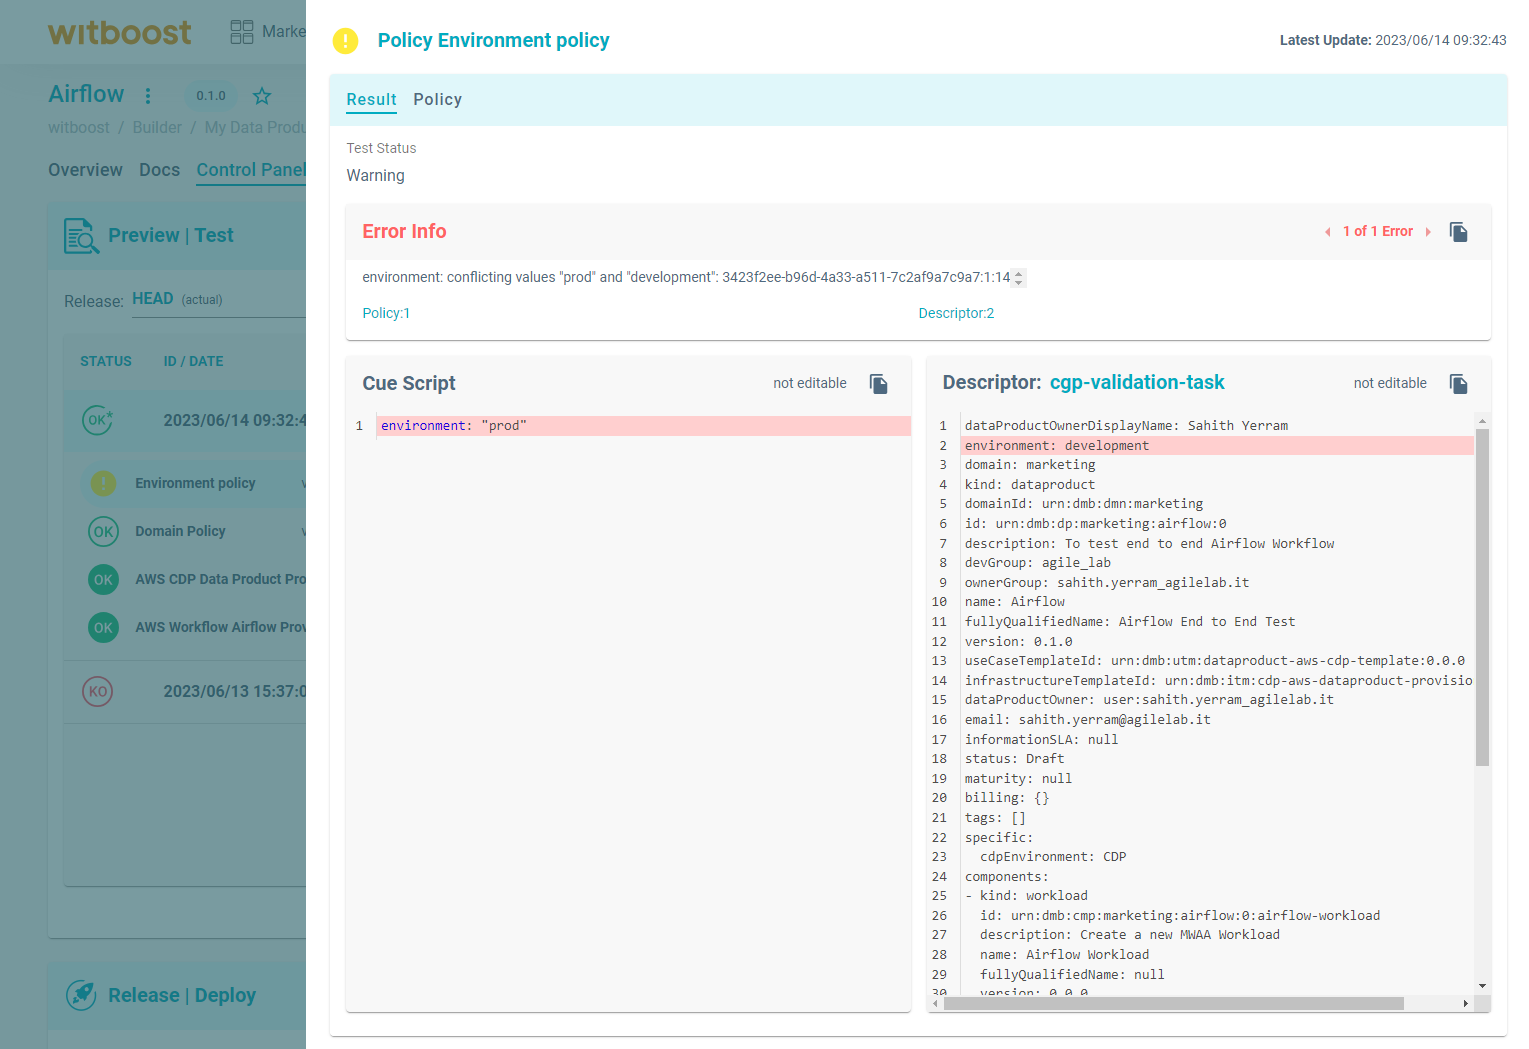
Explanation of the error thrown by a Warning policy, where the value for the environment was not the expected one.
Checking results
When there are multiple governance entities defined in a single Witboost installation, it can be difficult to see the impacts of all of them together. For developers, policies and metrics are automatically executed when deploying new resources (or at runtime on already deployed ones), so usually they are concerned only with the resolutions of the errors highlighted by the governance entities. But for the platform team, which is in charge of defining them, it's interesting to understand how big of an impact policies are having on the company and on the developers' day to day experience. For example, a platform team member could be interested in questions such as: "what is the policy that is failing the most?", "how many policies are actively being evaluated right now?", "how many deployments failed due to policies?".
To answer all these questions, Witboost provides a dedicated page for platform team members to review the effect of policies created and check the impact they have. The "Policies Overview" page contains an overview on different aspects of the policies executions.
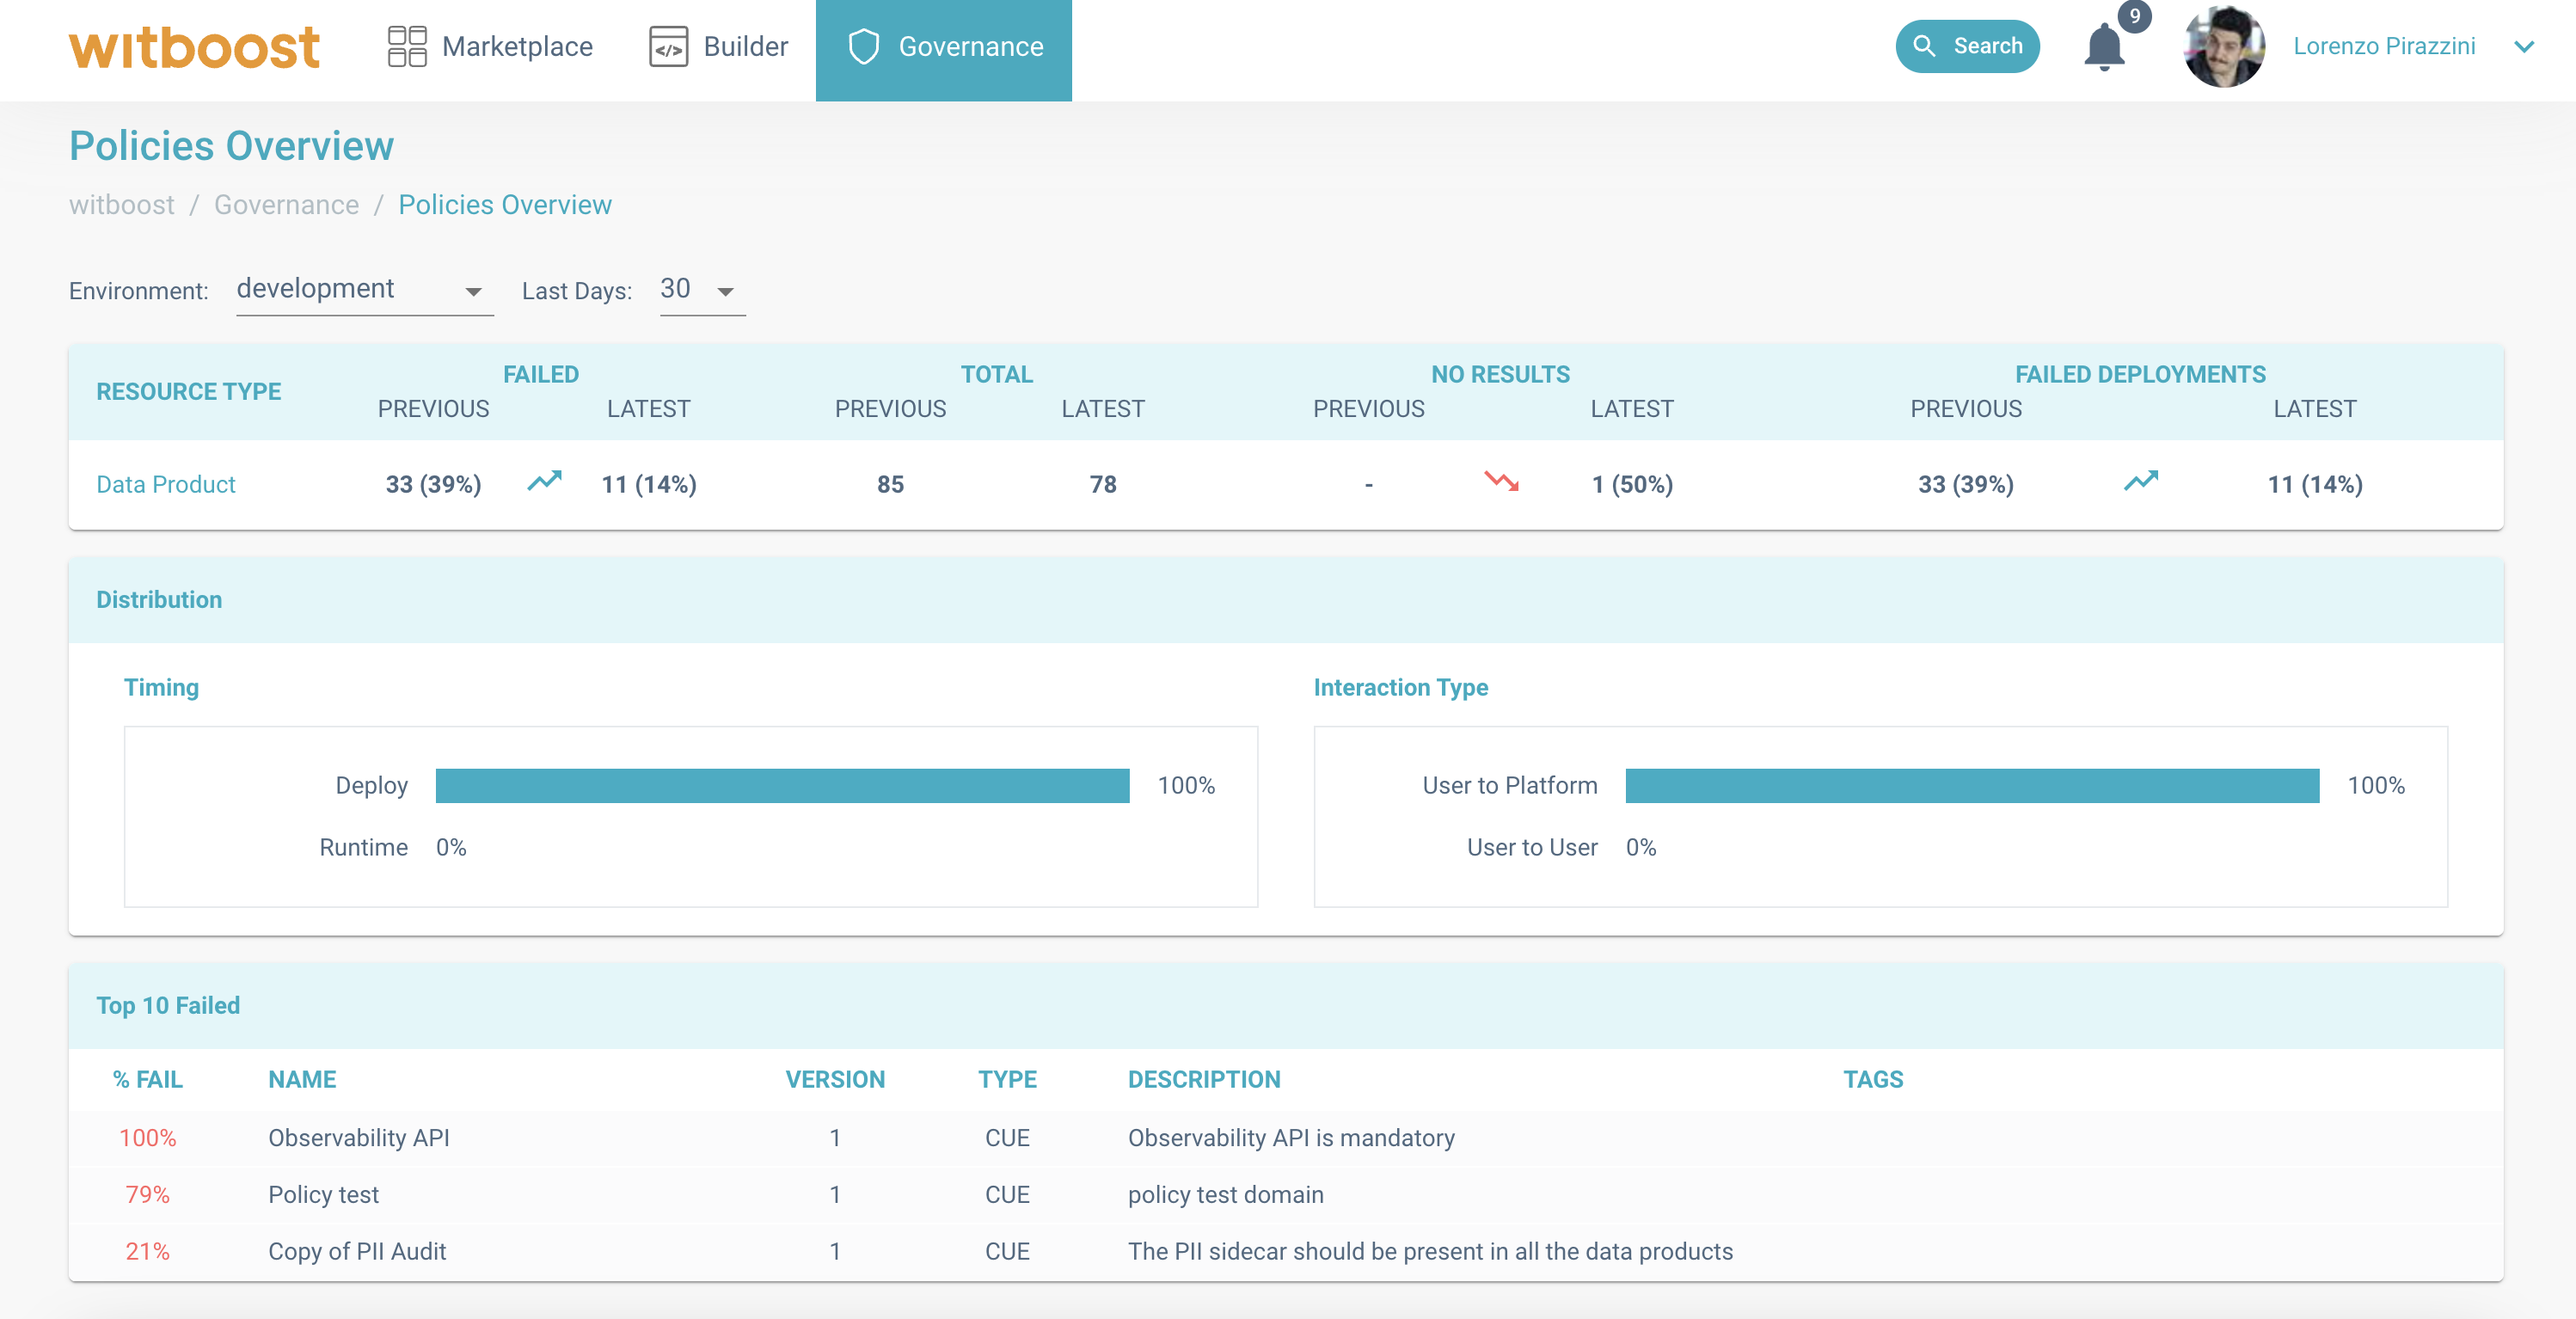
Policies Overview page, showing the behaviour of the last 10 days compared to the previous 10 days.
As you can see, on the top of the page there are a set of selectors that let you choose the environment you are interested in, and a time range. The time range represents an interval containing the last X days, ending today. All the tables in the page are then filtered using the values selected in this stage: by changing any of the values, the tables will be loaded again with values relative to the selected filters.
Then, the page is divided into three main sections, affected by the aforementioned filters:
- The first section is a table that shows a summary for all the resource types handled by the platform. For each
resource type, the table contains four indicators, for the current selected range, and for the same range the
previous month. In this way, the platform team members can see how the trend changed: what kind of effect did the
policies created in the current month have? Did they improve the experience with respect to the previous month? Are
they preventing errors to be made? To answer these questions, and make other analysis, the four values displayed in
this section are:
- Total: How many policies were executed at least once in the selected interval and environment. Draft and disabled policies are excluded.
- Failed: How many policies failed at least once in the selected interval and environment. Draft and disabled policies are excluded.
- No results: How many policies were not executed even once in the selected interval and environment. Draft and disabled policies are excluded.
- Failed deployments: The number of failed deployments due to a policy that failed in the selected interval and environment.
- The second section is a summary of the distribution of policies in the last days for the selected environments, in particular: how many policies are defined at runtime versus how many at deployment time? How many policies have been annotated to affect the user-to-user contracts, with respect to the user-to-platform ones?
- The third section represents instead the policies that failed the most in the selected environment and interval. This query selects the top 10 policies that failed more in percentage (number of failures over the total number of executions) in the selected interval and environment. Here are reported all kinds of failures: blocking and not blocking, for all kinds of policies (draft policies are excluded). The policies in this section are sorted per percentage of number of failures, so you will find a policy that was executed 4 times but failed all the times (100%) at a higher position then a policy that was executed 100 times, and failed 98 times (98%). Given this assumption, this table becomes more and more valuable for policies that are executed multiple times, since new policies will often be in the top places when just introduced. By clicking on a policy in this table, all the policy's results is displayed in the "Policy Results" page.
The "Policy Results" page is an additional tool that the platform team can use to get more insights on what effect policies have on the development lifecycle.
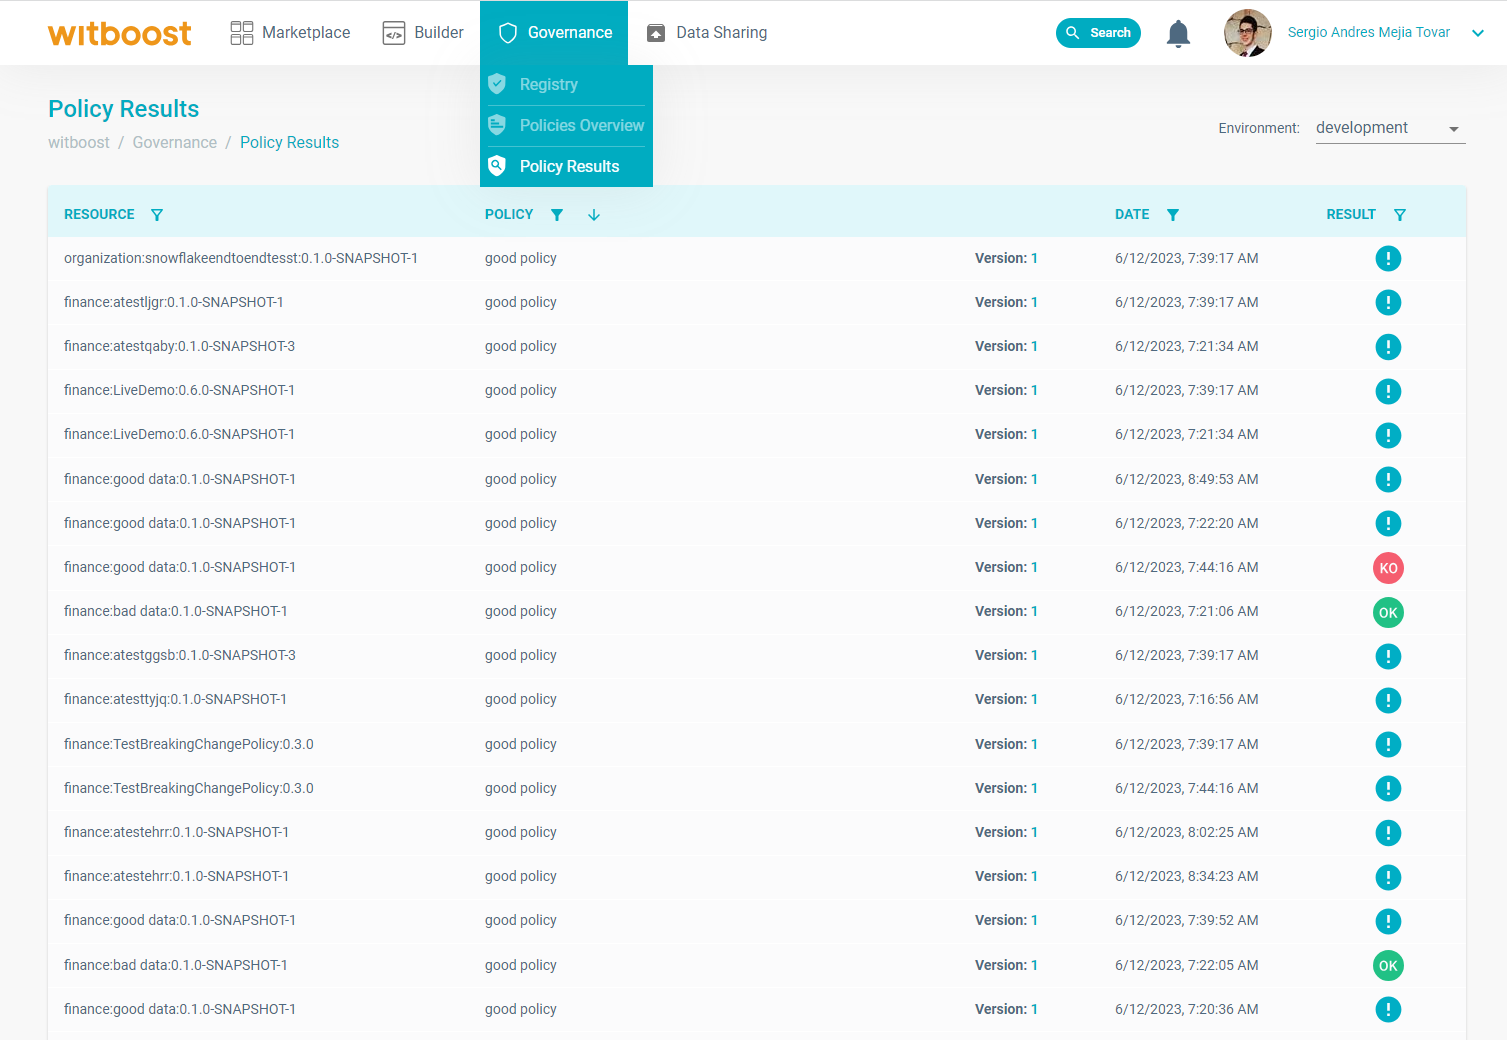
Extract of the policy results page showing all the evaluation results of the governance platform for an environment and a set of filters
This page contains all the results of all the policies inside Witboost. A result is identified by three attributes: the policy, the resource, and the evaluation timestamp. For this reason, in this page the results are displayed in a table that highlight those three details for each result. The user can then filter results by adding constraints on each of them: e.g. by selecting a resource you can see all the policies results generated from validating it; by selecting a policy, you can see all the results generated by it; by selecting a time range you can see all the results generated by a policy in that interval.
By clicking on a result, the policy result page is opened, where you can see more details regarding the result itself: the descriptor of the resource, the policy's metadata, and the result attributes (including the outcome and teh JSON result details, if present).