Passive Trigger
A policy (metric) whose trigger is passive is a Passive policy (metric). This type of policy can receive results from external services asynchronously, so that they are fully integrated with the Computational Governance Platform. Since the execution schedule of this policy is completely independent of Witboost, this policy's timing will be always Runtime.
Passive policies/metrics are useful when you have a running instance of a resource, and you want to collect values from it in order to display them to the end users. Think for example about a resource that you deployed: even if you have runtime policies that can be scheduled to run multiple times in a month, you could be interested in sending results only when you have them. This change in the direction of the interaction (it's not the policy that is actively triggered on a resource, but instead the policy is passively waiting to receive results pushed from an external service) allow for multiple new use cases: a typical use case could be to monitor the status of a running resource, by pushing alerts in case a failure is detected.
In this case, passive policies are never executed directly (for this reason the "trigger" is defined as passive, they will never be explicitly invoked). But rather, microservices can push their results to Witboost by including in the result all the needed information: which is the resource that generated such result, what is the outcome, and what is the passive policy that should hold the result itself. By doing this, the result will be shown in the marketplace (as a flag or score) if the result's resource exists in there. Passive policies (and metrics) are a tool that let you collect runtime values from your resources and display them to the end users.
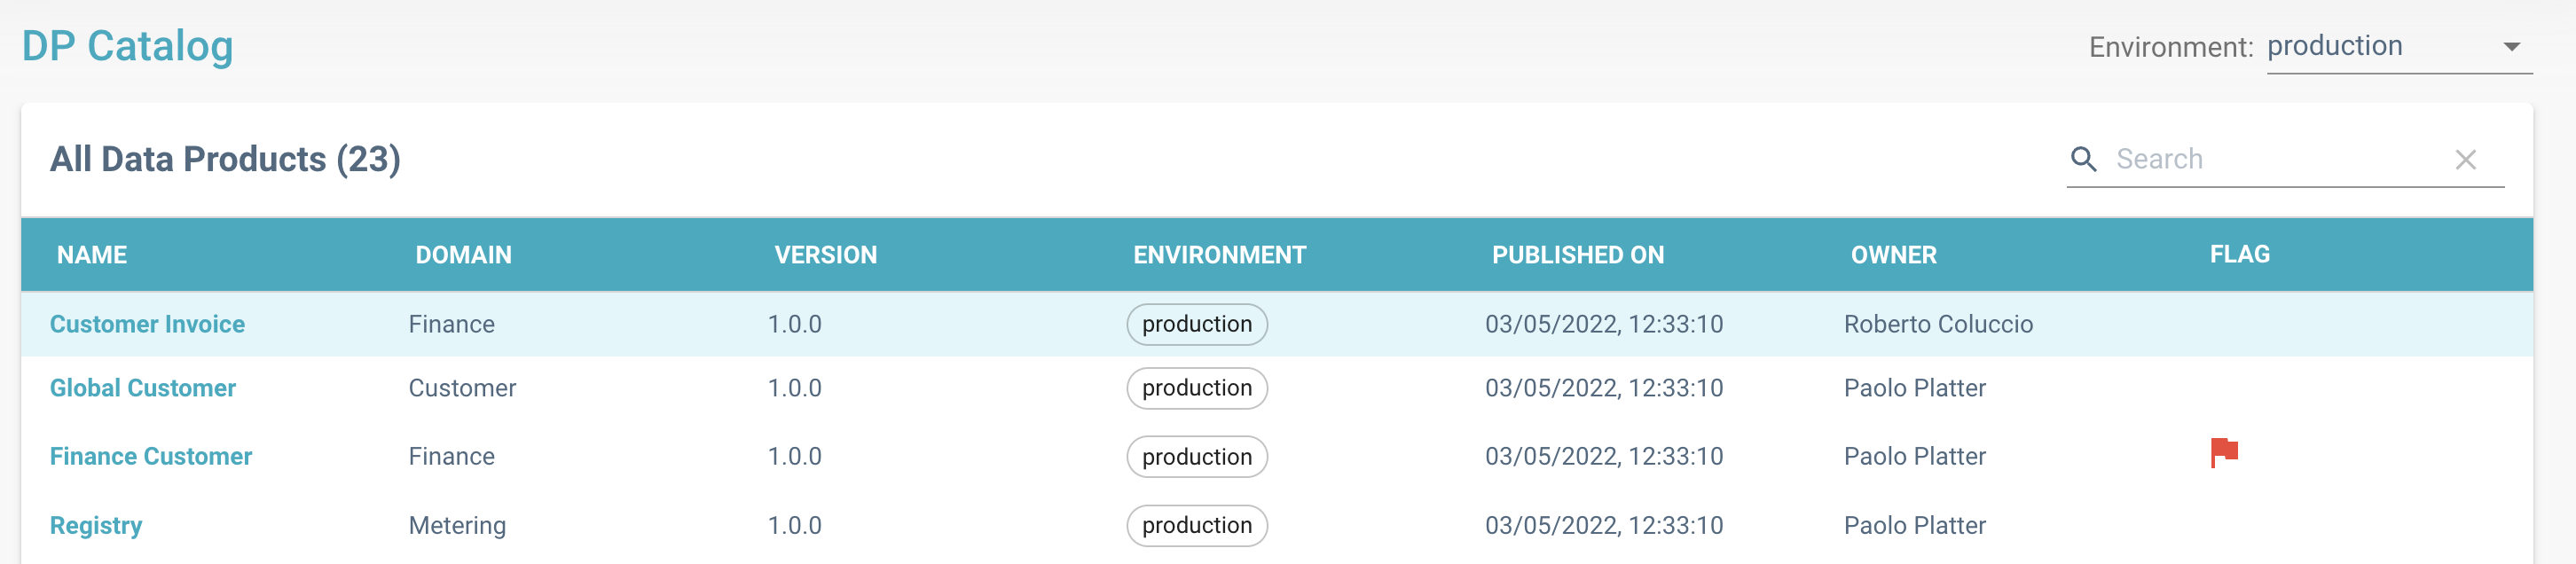
In the marketplace, the resources with associated results (passive ones included) have some icons:
- yellow and red flags represent results generated from failing policies (the red flag represent policy errors, while the yellow one represent all other kinds of failures)
- the metric icon means that for that resource there are metric results evaluated at runtime
By opening the resource on the marketplace, and clicking on the "Flag" button, you can check more details regarding the policies and metrics that generated results for the resource. Remember that you will always see only the latest result for policies and metrics, and that you can see all of their details by clicking on them.
When creating a passive policy (or a passive metric) you will be asked to define when the policy will be scheduled. But this is a little confusing: why do I have to add a schedule for a policy that will never be triggered, since I will be sending results for it whenever I want? The answer is that when defining a passive policy/metric, you will be expecting to receive some results, but you will have no control over them. By defining a schedule, you are telling Witboost that you will expect to receive at least a result in that scheduled time. If no results are sent to Witboost in the scheduled interval, you will see in the UI a "no data" result, that tells you that even if expected, the passive polic/metric did not send any result.
Sending a passive result
To send results to a passive policy/metric, two routes are available in the Provisioning Coordinator:
- for sending policies results: POST EvaluationResults
- for sending metrics results: POST EvaluationResults
Even if they are distinct endpoints, they are very similar, so we will present them as a single one having all the common features.
The endpoint takes as input:
- a path parameter which represents the policy/metric identifier. All the results sent within this context will be assigned as results of the passive policy/metric selected here.
- a query parameter that represents the environment. Since a policy can be defined on multiple environment, this allows you to define for which environment the resource is generating the results.
- as body an array of results for the same
For the same resource, each policy/metric result must be unique, meaning there cannot be two results for the same policy/metric for the same resource at the same timestamp.
An example request body that contains just one evaluation result for a policy is as follows:
[
  {
    "resource": {
      "id": "urn:dmb:dp:marketing:a-deployed-dp:0",
      "displayName": "A deployed dp",
      "descriptor": "name: marketing.a-deployed-dp.0\ndomain: finance"
    },
    "result": {
      "satisfiesPolicy": true,
      "errors": [],
      "details": {}
    }
  }
]
while an example of a single result for a metric could be:
[
  {
    "resource": {
      "id": "urn:dmb:dp:marketing:a-deployed-dp:0",
      "displayName": "A deployed dp",
      "descriptor": "name: marketing.a-deployed-dp.0\ndomain: finance"
    },
    "result": {
      "value": 89,
      "errors": [],
      "details": {}
    }
  }
]
Some notable fields are:
result.satisfiesPolicyandresult.value: they represent the actual outcome for the policy (satisfiesPolicy) or the metric (value). WhensatisfiesPolicyis false, it means that the policy evaluation failed, or successful in case it's true. In the same way, thevaluefield contains the numeric value calculated by the metric as a result of its execution.result.details: a JSON object that contains additional details related to the policy/metric outcome. It's a field without fixed schema, where you can put a JSON object representing additional information of the result. This field will be displayed in the UI if present.result.errors: an array of strings representing errors that will be displayed in the UI as regular execution errors. This field should be used to notify the user regarding what went wrong, and how users can act to solve them.
Keep in mind that a single request can contain several evaluation results. For a detailed description of each field that should be filled in the request, head to the API specification .
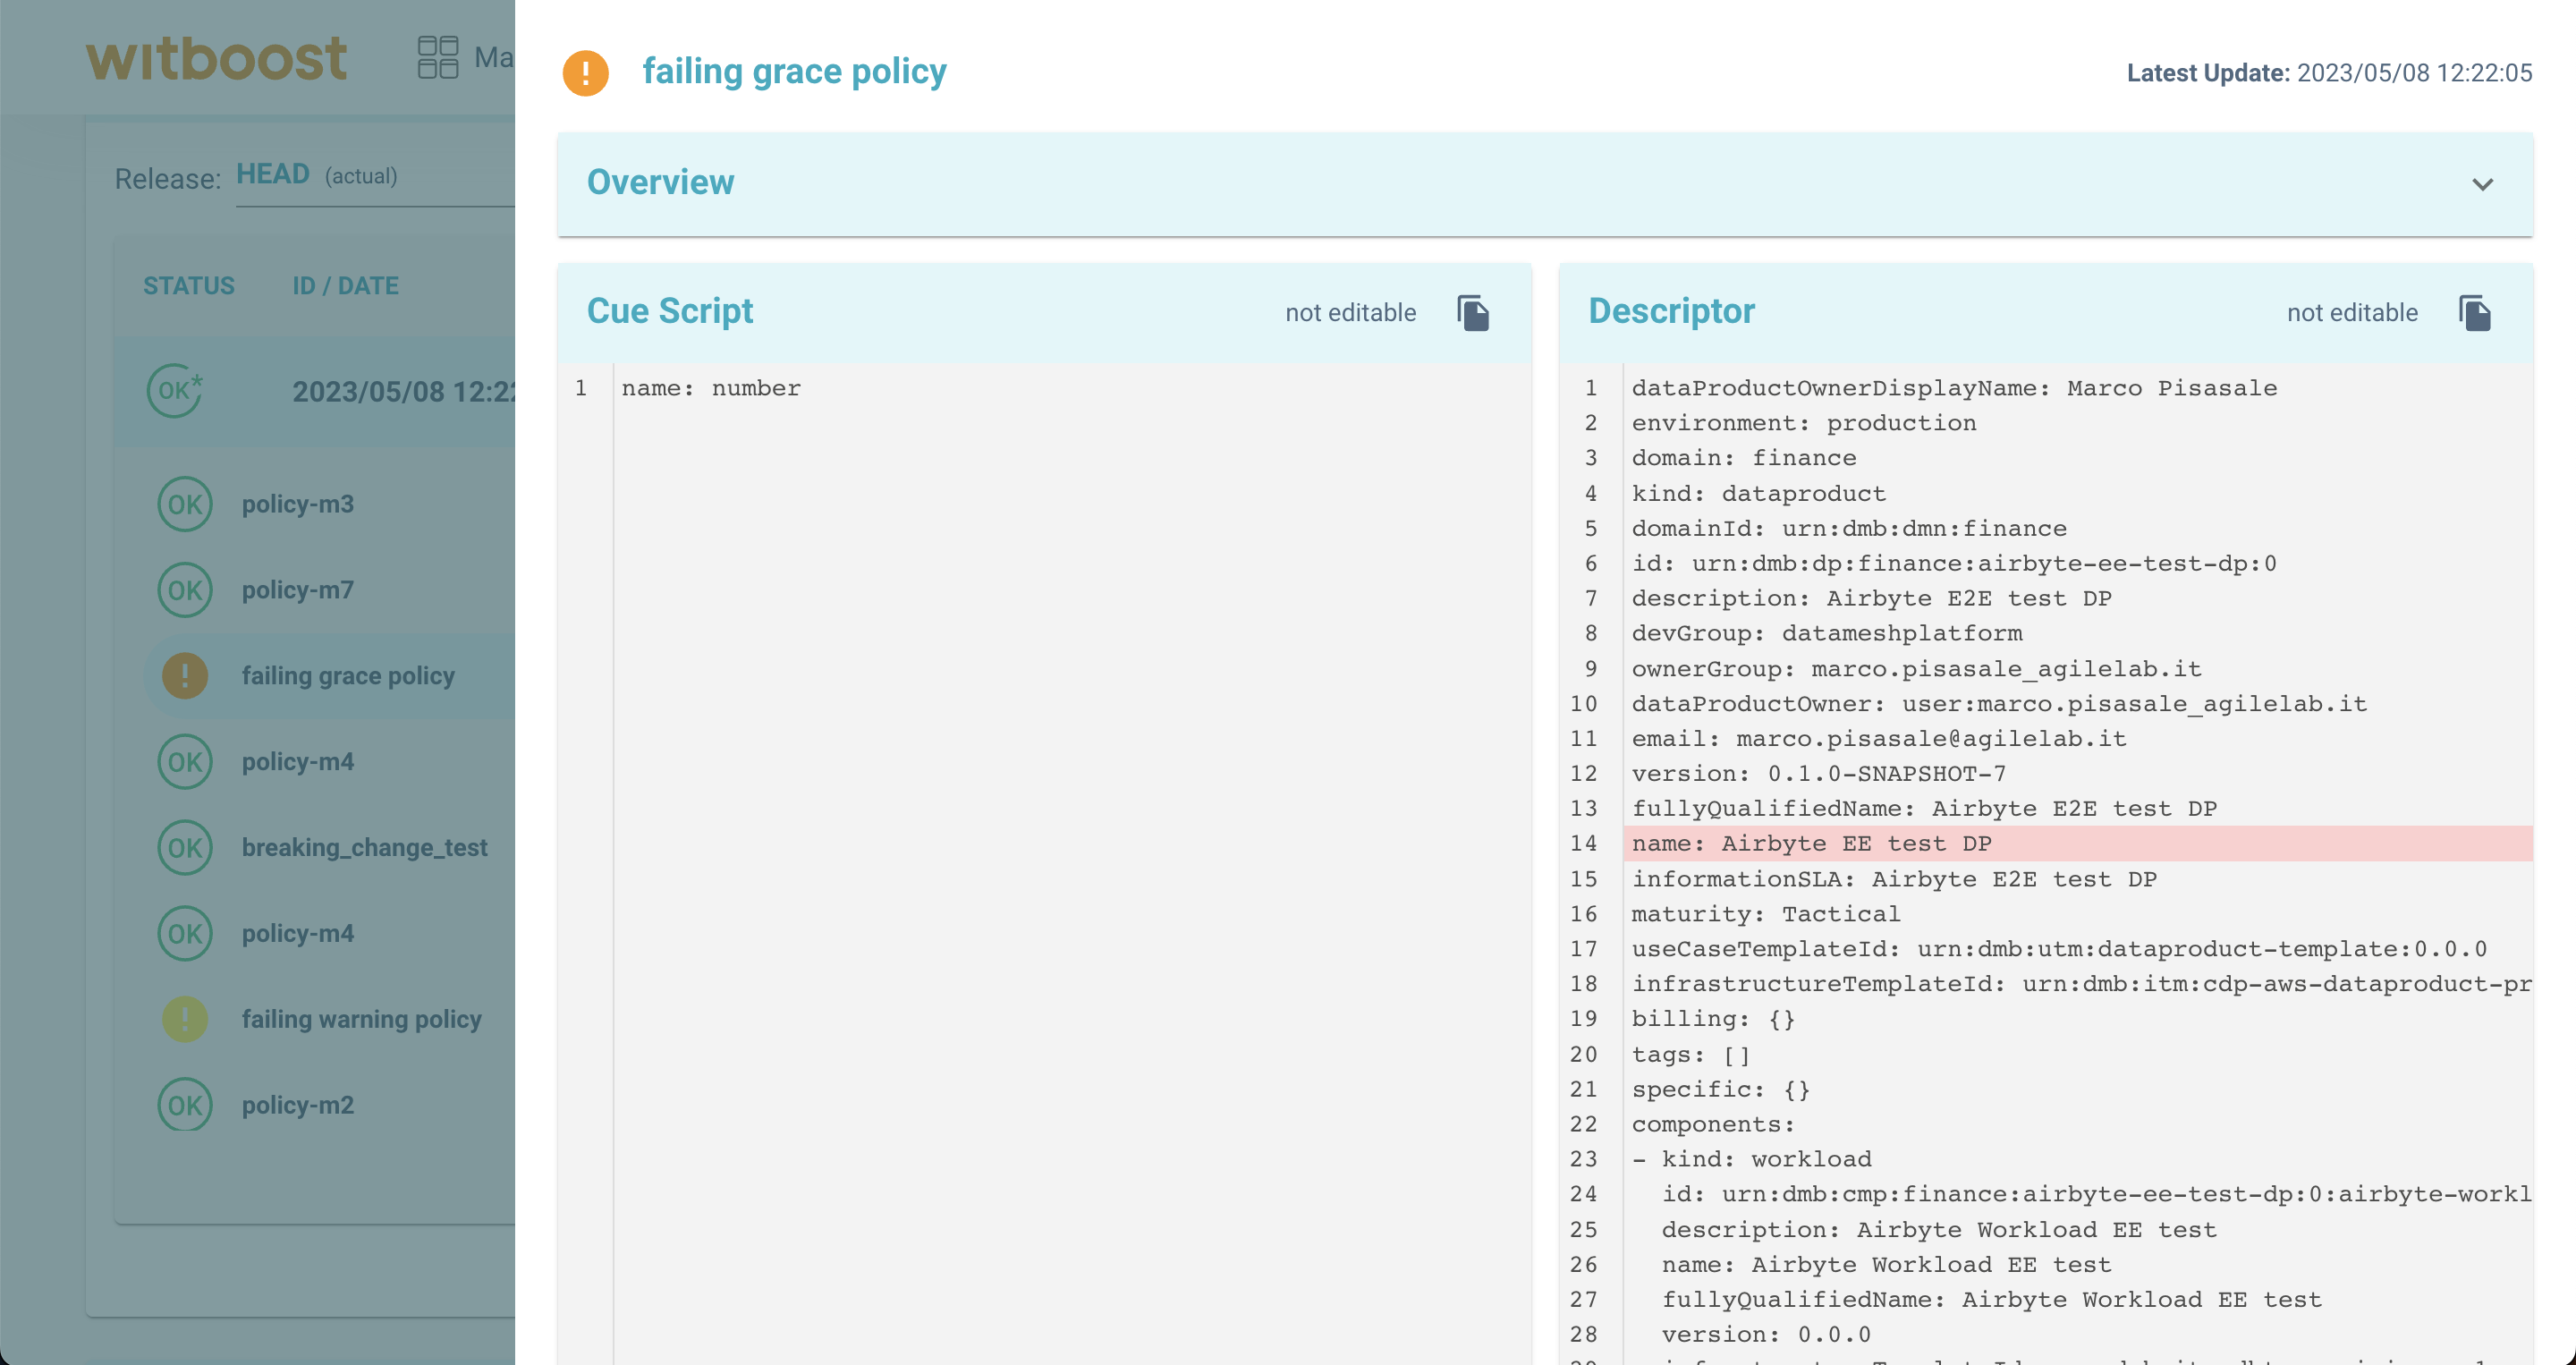
The resource sent inside the result comes with a descriptor field. This field is mandatory but can be left empty if
there is no meaningful descriptor in the policy's scope. If present instead, it can be helpful to troubleshoot a failed
evaluation, since the Test panel will show the lines in the resource's descriptor that caused the policy check failure.
Since passive policies and metrics cannot be automatically triggered by Witboost, they can't be tested as all the other ones. To check if they are actually working, you can send results using the aformentioned endpoints, and check when they appear in the marketplace pages.